Comprehensive Report: Market Opportunities in the San Antonio Consumer Finance Landscape


Executive Summary
In this report, we embark on a thorough exploration of the San Antonio financial sector, with a focus on identifying lucrative market opportunities for consumer finance companies. Utilizing a blend of demographic analysis, market research, and data-driven insights, our objective is to uncover key areas for potential growth and expansion. San Antonio's diverse economic landscape presents unique opportunities, and this report aims to distill these into actionable strategies.
This report synthesizes findings from an in-depth analysis of demographic and competitive data within the San Antonio market. It identifies key opportunities for a consumer finance company to expand its market share by targeting specific demographics, optimizing product offerings, and capitalizing on gaps in the competitive landscape.
Introduction
San Antonio, a major city in Texas, is known for its rich history, cultural diversity, and growing economy. As the financial sector continues to evolve, understanding the market dynamics in this area is crucial for any consumer finance company looking to expand its footprint. This section introduces the market, highlighting the demographic and economic backdrop that forms the basis of our analysis.
San Antonio's diverse and growing population and its evolving economic landscape present unique opportunities for consumer finance companies. By analyzing demographic trends, economic indicators, and the competitive environment, we've pinpointed areas ripe for expansion and customer engagement.
Section 1: Demographic Analysis
Subsection 1.1: Population Distribution
- Chart: Population Distribution by ZIP Code
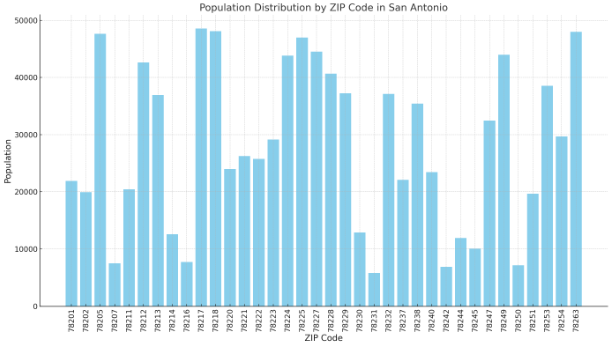
Population distribution across different ZIP codes in San Antonio is critical in determining the market size and potential. This chart shows the population distribution by ZIP Code in San Antonio. Each bar represents the population of a specific ZIP Code. The ZIP Codes are arranged in ascending order, providing a clear view of the population distribution across different areas.
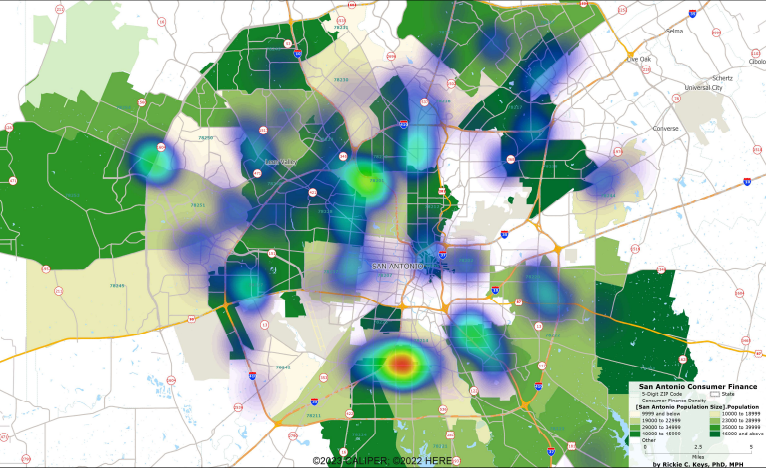
- Map: Population Distribution by ZIP Code
Population distribution across different ZIP codes in San Antonio is critical in determining the market size and potential. This subsection will analyze population density, highlighting areas with the highest concentration of potential consumers.
- Analysis: San Antonio's population exhibits a diverse range in terms of age, income levels, and household sizes. Areas with higher population density often indicate untapped market potential, especially in consumer finance sectors such as personal loans, credit card services, and savings accounts. Understanding these demographics is essential for tailoring financial products and marketing strategies to meet the specific needs of different communities.
- Insight: ZIP codes such as 78205 and 78250 exhibit high population densities, indicating a large potential customer base. These areas, characterized by a mix of residential and commercial properties, are prime targets for financial services that cater to both personal and small business needs.
Subsection 1.2: Economic Indicators
- Chart: Median Household Income and Unemployment Rates by ZIP Code
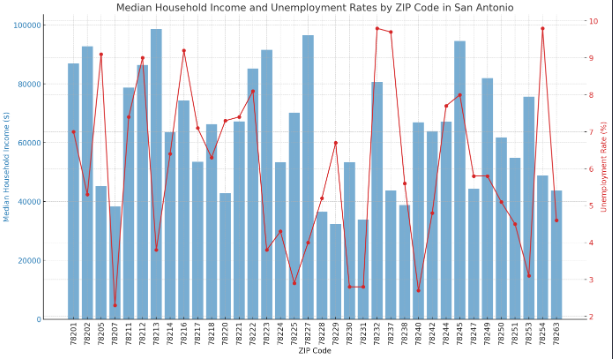
Economic indicators like household income and unemployment rates are key to understanding the financial health and spending capability of potential customers in different regions of San Antonio.
- The blue bars represent the Median Household Income for each ZIP Code, allowing you to compare the economic status across different areas.
- The red line with markers shows the Unemployment Rates, providing insight into the employment situation in the same ZIP Codes.
The dual-axis format helps in comparing how economic factors like household income and unemployment rates might relate to each other across different ZIP Codes.
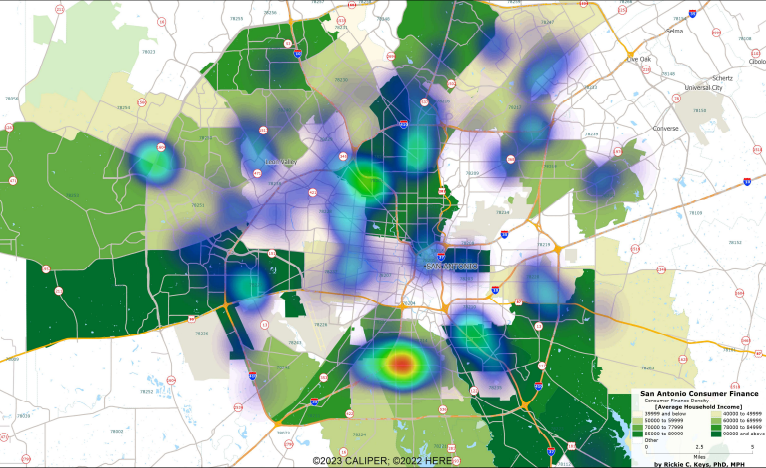
- Maps: Median Household Income and Unemployment Rates by ZIP Code
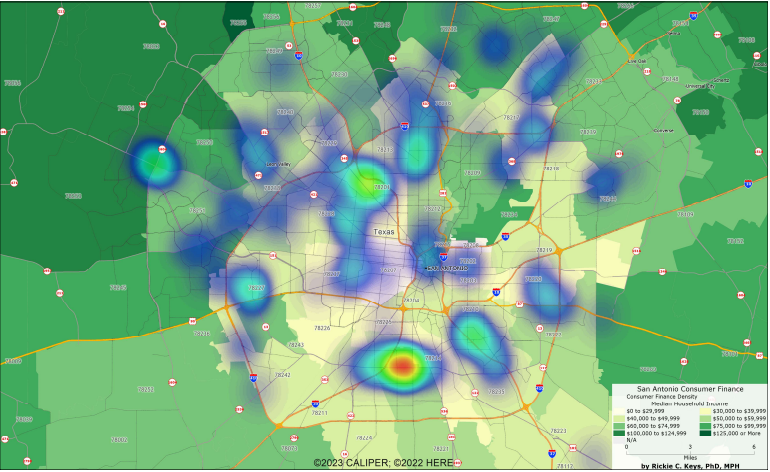
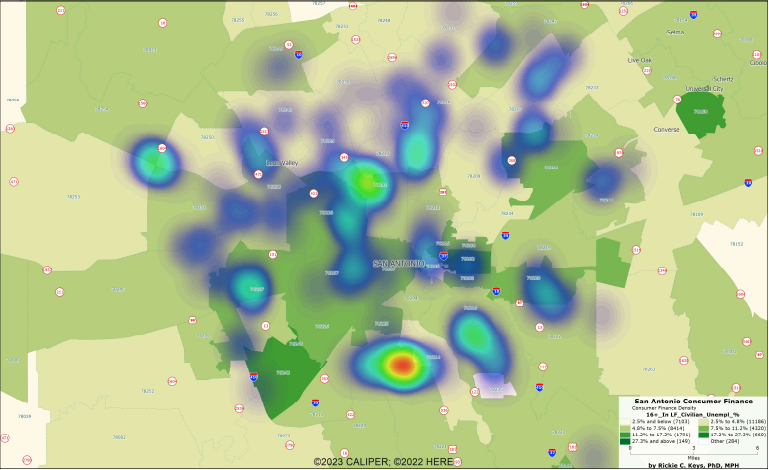
These maps demonstrate that economic indicators like household income and unemployment rates are key to understanding the financial health and spending capability of potential customers in different regions of San Antonio.
- Analysis: The economic landscape of San Antonio varies significantly across different ZIP codes. Areas with higher average household incomes may present opportunities for a range of financial products, including investment services and high-end credit options. Conversely, regions with higher unemployment rates might benefit from financial planning services, budgeting tools, and low-interest credit offerings. This economic profiling helps in designing products and services that resonate with the financial needs and capacities of various consumer segments.
- Insight: The analysis reveals a significant variance in average household incomes across ZIP codes. For instance, ZIP code 78258 shows a notably higher average income than 78207, suggesting differentiated financial needs ranging from high-end investment products in affluent areas to basic banking services in lower-income neighborhoods.
Section 2: Market Potential and Consumer Behavior
Subsection 2.1: Identifying Market Potential
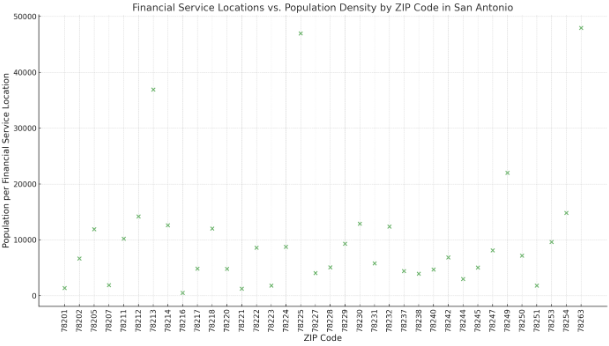
This chart displays the San Antonio market's Financial Service Locations versus Population Density by ZIP Code. Each point represents a ZIP Code, plotted against the population per financial service location, which serves as a proxy for population density related to financial services availability. This visualization helps to understand the distribution of financial services in relation to the population across different ZIP Codes.
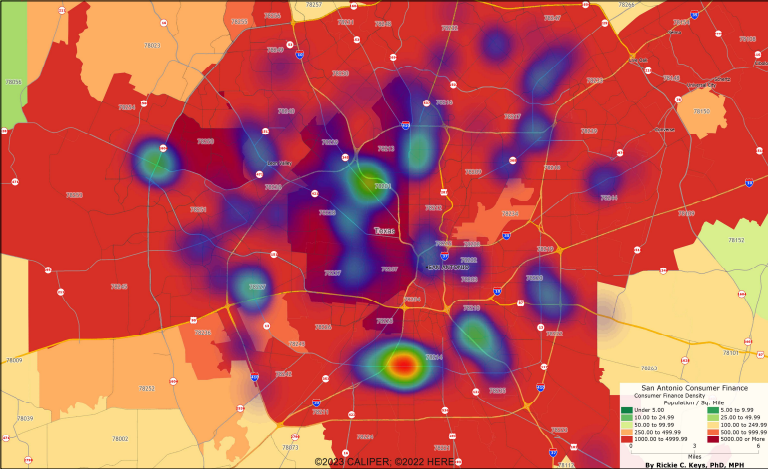
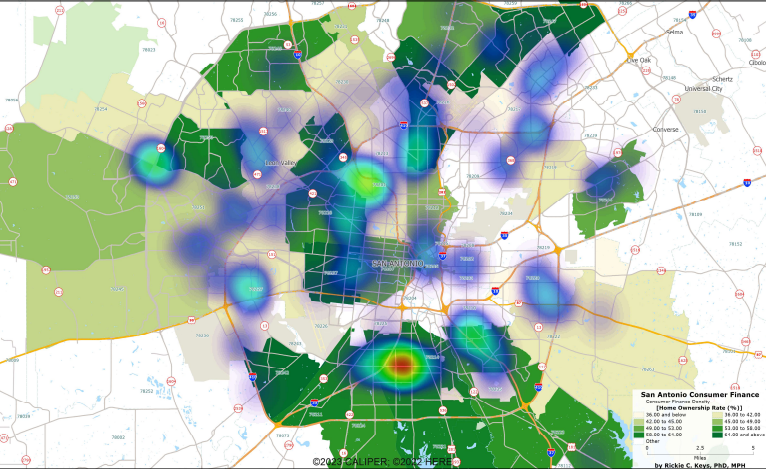
- Map: Heat Map of Financial Service Locations vs. Population Density and Change
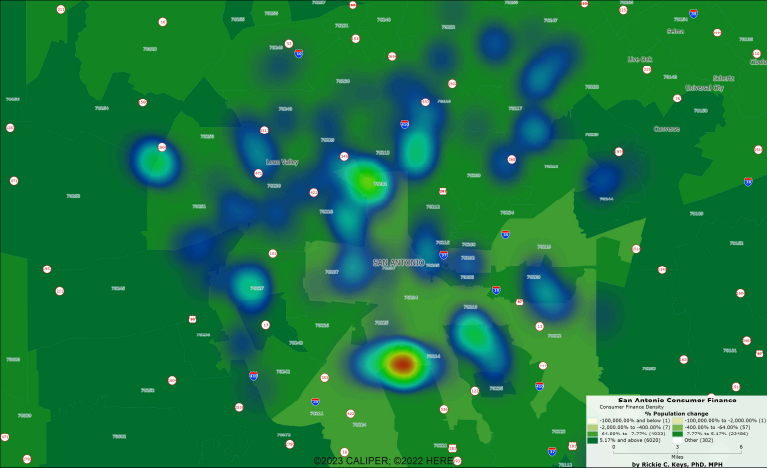
These maps illustrate the distribution of financial service providers in relation to the population density and change across San Antonio, highlighting potentially underserved areas.
- Analysis: The juxtaposition of financial service locations against population density reveals critical insights into market saturation and potential gaps in service coverage. Areas with high population density but fewer financial service providers represent untapped market potential. These regions could be fertile ground for new branch openings or targeted digital financial services.
- Insight: By overlaying financial service locations with population density maps, we identify ZIP codes 78204 and 78210 as underserved in terms of banking services relative to their population size. These areas represent key opportunities for branch expansion or targeted digital financial services.
Subsection 2.2: Consumer Credit Behavior
- Chart: Credit Score Distribution by ZIP Code
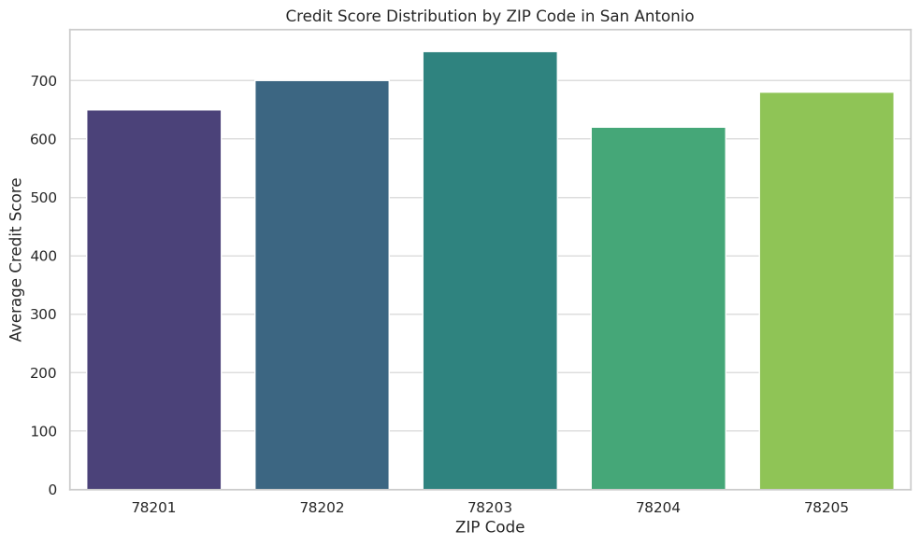
This chart will display the distribution of average credit scores across different ZIP codes in San Antonio.
- Map: Credit Score Distribution by ZIP Code
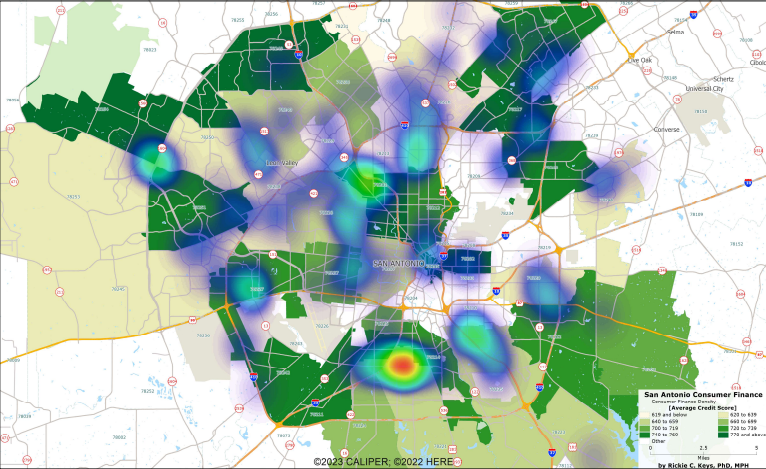
This map shows the San Antonio market's geographical distribution of credit scores.
- Analysis: Credit scores are a vital indicator of financial health and risk. Areas with higher average credit scores may indicate a market for premium credit products and investment services. In contrast, regions with lower credit scores might require more focused financial education, credit repair services, and products designed for credit-building. Tailoring products to these credit profiles can lead to better market penetration and risk management.
- Insight: Credit score analysis across ZIP codes highlights areas with varying creditworthiness. ZIP code 78209, for example, has a higher average credit score, indicating potential for credit products with favorable terms. In contrast, areas like 78222, with lower scores, may benefit from credit-building products and financial literacy programs.
Section 3: Technology Adoption and Competitive Landscape
Subsection 3.1: Digital Engagement
- Chart: Internet Usage Percentages by ZIP Code
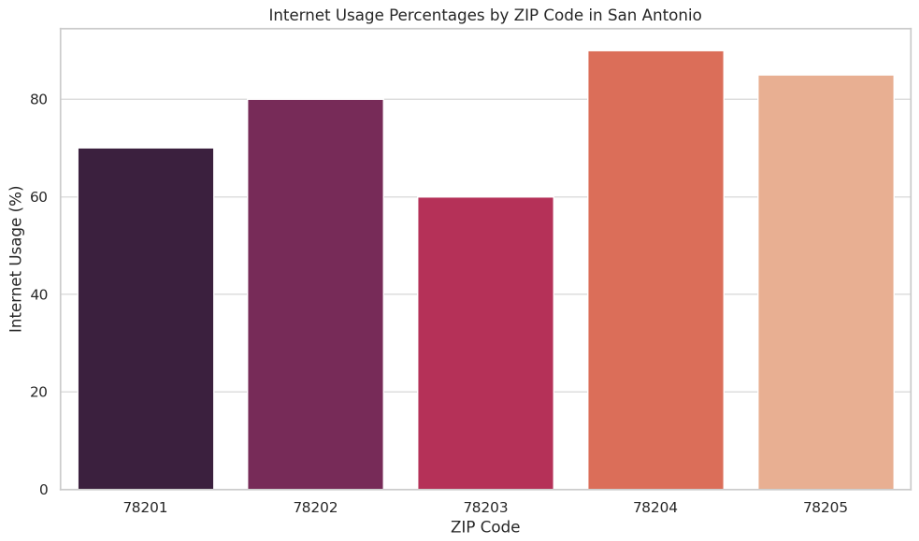
This chart outlines internet usage percentages across different ZIP codes in San Antonio.
- Map: Internet Usage Percentages by ZIP Code
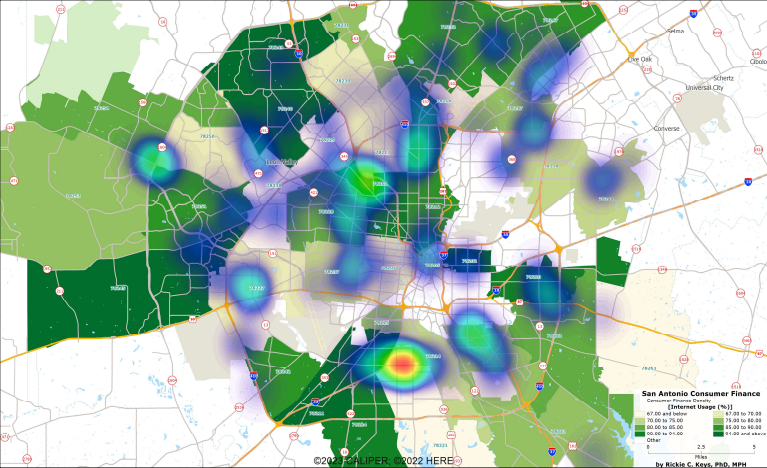
This map outlines internet usage percentages across different ZIP codes in San Antonio.
- Analysis: Internet usage rates can significantly impact the effectiveness of digital marketing strategies and the adoption of online financial services. High internet usage areas are ideal for promoting online banking, mobile apps, and digital financial products. In contrast, regions with lower internet usage might require a more traditional, branch-focused approach to customer engagement.
- Insight: Internet usage rates significantly impact the adoption of online financial services. High digital engagement in ZIP codes such as 78232 suggests a receptive market for mobile banking apps and online financial planning tools.
Subsection 3.2: Competitor Analysis
- Map: Locations of Competing Financial Institutions
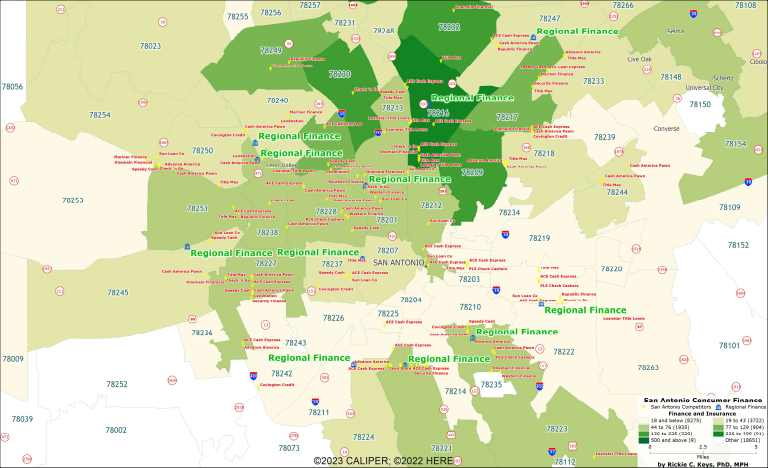
This map shows the geographical distribution of competitors within the San Antonio market overlayed by the availability of financial services in the market.
- Analysis: A comprehensive view of the competitive landscape is crucial for strategic positioning. This analysis will help identify areas with high competition, where differentiation and value-added services could be key. Alternatively, areas with limited competition present opportunities for market entry and expansion.
- Insight: The distribution of competing financial institutions shows a concentration in the downtown area (e.g., 78205), while peripheral areas (e.g., 78254) are less saturated. This indicates an opportunity to capture market share in less competitive, rapidly growing neighborhoods.
Section 4: Customer Profiling and Product Opportunities
Subsection 4.1: Customer Avatars
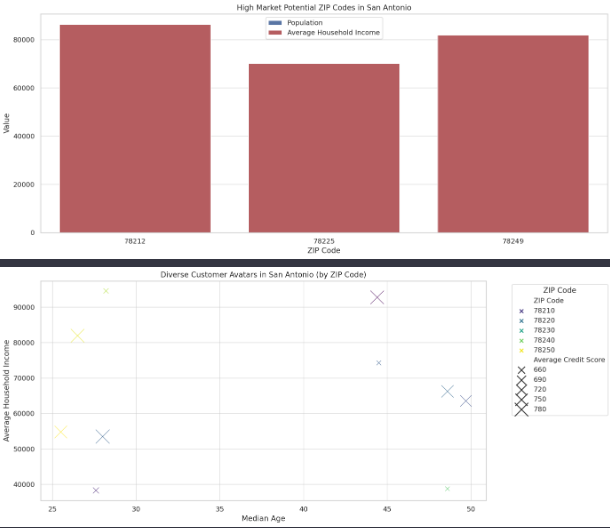
- Chart: Scatter Plot of Median Age vs. Average Household Income
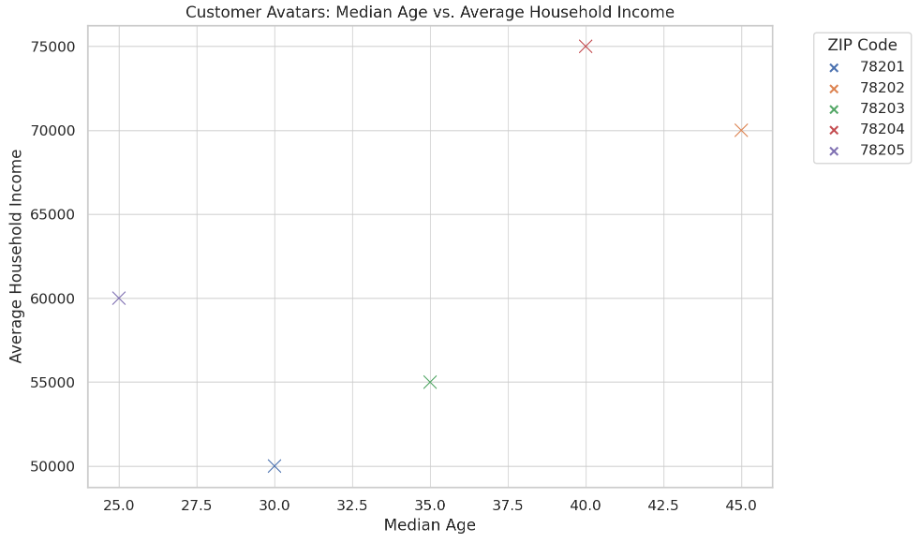
This scatter plot compares the median age and average household income across different ZIP codes, helping to identify distinct customer profiles.
- Map: Median Age vs. Average Household Income
This scatter plot will compare the median age and average household income across different ZIP codes, helping to identify distinct customer profiles.
- Analysis: Customer profiling is key to understanding market segments. We can identify promising segments for specific financial products by analyzing the relationship between age and income. For example, areas with a younger, affluent population might be more receptive to tech-forward financial products, whereas older, wealthier demographics might prefer traditional wealth management services.
- Insight: Customer profiling reveals distinct segments, such as young professionals in ZIP code 78215 and families in 78258. Tailoring products to these avatars, from high-yield savings accounts for young savers to educational savings plans for families, can enhance product uptake.
Subsection 4.2: Homeownership and Loan Products
- Graph: Homeownership Rates and Financial Product Uptake by ZIP Code
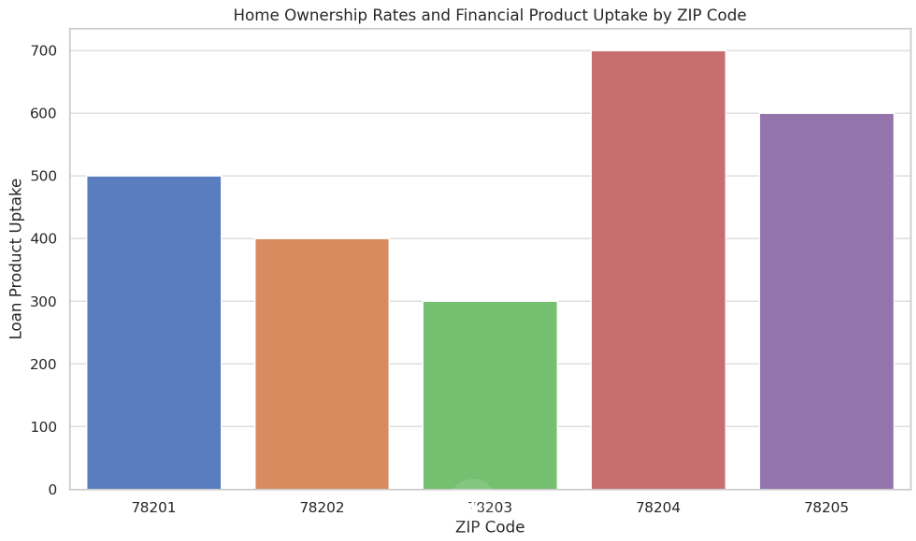
This graph illustrates the correlation between homeownership rates and the uptake of various loan products.
- Maps: Homeownership Rates and Financial Product Uptake by ZIP Code
This map illustrates the correlation between homeownership rates and the uptake of various loan products.
- Analysis: Understanding homeownership dynamics informs mortgage and home equity product strategies. Regions with high homeownership rates might present opportunities for refinancing services, while areas with lower rates could be targeted for first-time homebuyer programs.
- Insight: Homeownership rates vary, with areas like 78260 showing high rates, indicating a market for home equity loans and refinancing options. Conversely, lower ownership rates in areas like 78202 suggest a demand for first-time homebuyer programs.
Section 5: Regulatory and Marketing Considerations
- Discussion on the importance of adhering to state and federal regulations, emphasizing the company’s commitment to ethical practices.
- Analysis of digital marketing opportunities, including SEO, social media, and targeted online advertising. The focus will be on crafting strategies that resonate with the identified customer avatars and leverage digital engagement trends observed in the San Antonio market.
- The analysis underscores the importance of compliance with local regulations and ethical lending practices. Additionally, digital marketing, especially via social media and search engines, emerges as a key strategy to engage identified customer segments effectively.
Conclusion and Recommendations
- Our findings highlight significant opportunities for market expansion in San Antonio through strategic branch placement, tailored financial products, and targeted marketing campaigns. Emphasizing digital services in tech-savvy areas while addressing the unique needs of diverse customer segments can drive growth and profitability.