Unveiling Montgomery's Manufacturing Landscape: An In-Depth Sector Analysis and Development Roadmap

Introduction
The manufacturing sector in Montgomery stands as a pivotal cornerstone of the local economy, embodying a diverse array of industries that collectively contribute to the city's economic vitality and employment landscape. This comprehensive analysis delves into various facets of the manufacturing sector, employing a series of detailed visualizations and demographic insights to unravel the sector's economic impact, employment trends, financial stability, and geographical distribution. By exploring the distribution of companies across industry sectors, employee size ranges, sales volume ranges, and credit score ratings, this report aims to shed light on the manufacturing sector's multifaceted contributions to Montgomery's economy.
Furthermore, the examination extends beyond mere numerical analysis to incorporate a geographical and demographic perspective, providing a nuanced understanding of the sector's placement within the broader socio-economic fabric of the city. Through a series of maps and demographic reports, we explore the manufacturing density, workforce availability, educational attainment levels, infrastructure access, and the economic health of areas hosting manufacturing activity. This geographical and demographic analysis offers valuable insights into the strategic development opportunities, pinpointing areas ripe for investment, regions with untapped labor potential, and sectors with significant growth prospects.
The Montgomery Manufacturing Report, serving as the foundation of this analysis, presents a tiered examination of the manufacturing sector's demographics, including income levels, population dynamics, and household composition within various drive-time radii from manufacturing locations. This demographic deep dive is crucial for understanding the workforce characteristics and socio-economic landscapes that influence manufacturing in Montgomery.
By synthesizing findings from the industry sector, employment impact, economic contribution, credit score analyses, and geographical distribution, along with detailed demographic insights, this report aims to outline a roadmap for future growth and development in Montgomery's manufacturing sector. It highlights the necessity of targeted economic development strategies, workforce engagement initiatives, and infrastructure improvements to foster a robust, inclusive, and thriving manufacturing landscape. This analysis not only underscores the current state of manufacturing in Montgomery but also illuminates pathways toward enhancing employment opportunities, wage growth, and overall economic benefits for the city and its residents.
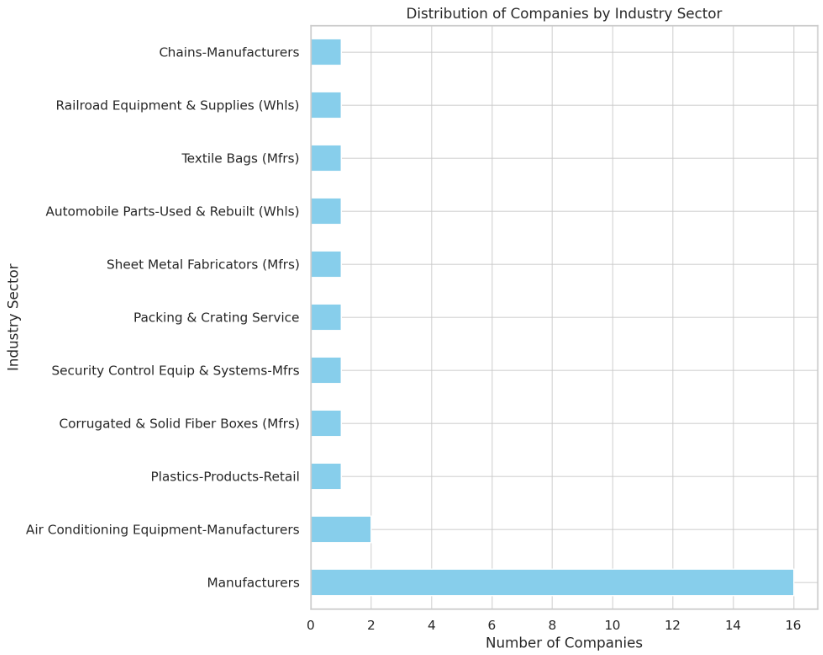
The bar graph above illustrates the distribution of companies by industry sector within Montgomery's manufacturing sector. This visualization helps understand the variety and concentration of industries, highlighting the sectors with the most significant number of companies, which can be focal points for economic development efforts.
Next, let's move to the Employment Impact Analysis, where we'll create a bar graph to display the number of companies within each employee size range. This will help us estimate the employment impact of the manufacturing sector.
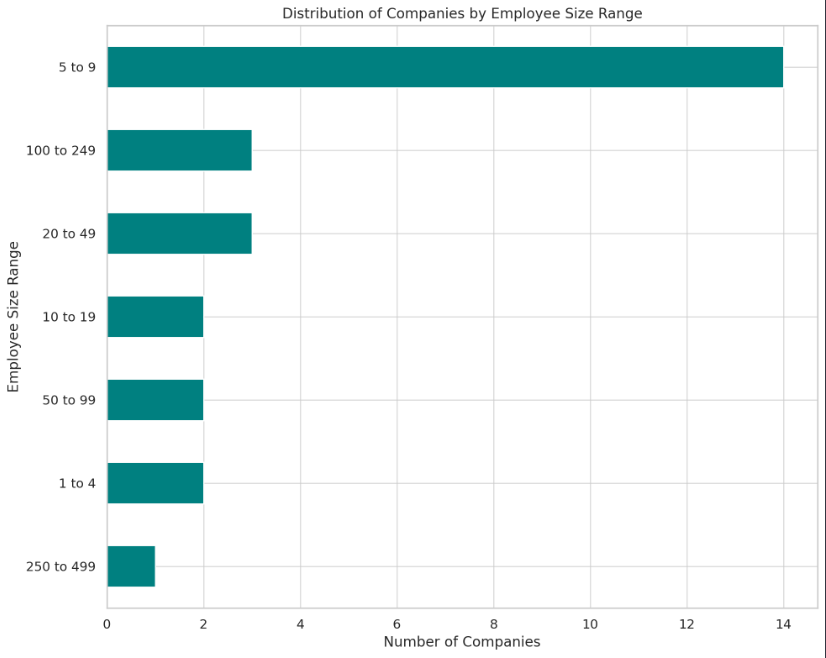
The bar graph above shows the distribution of companies by employee size range, providing insight into the employment impact of the manufacturing sector in Montgomery. This visualization helps identify manufacturing companies' most common size ranges, which is crucial for understanding employment trends and targeting initiatives to support job growth.
Moving forward, we'll conduct the Economic Contribution Analysis by creating a bar graph to illustrate the distribution of companies across different sales volume ranges. This analysis will help estimate the economic contribution of these companies to the local economy.
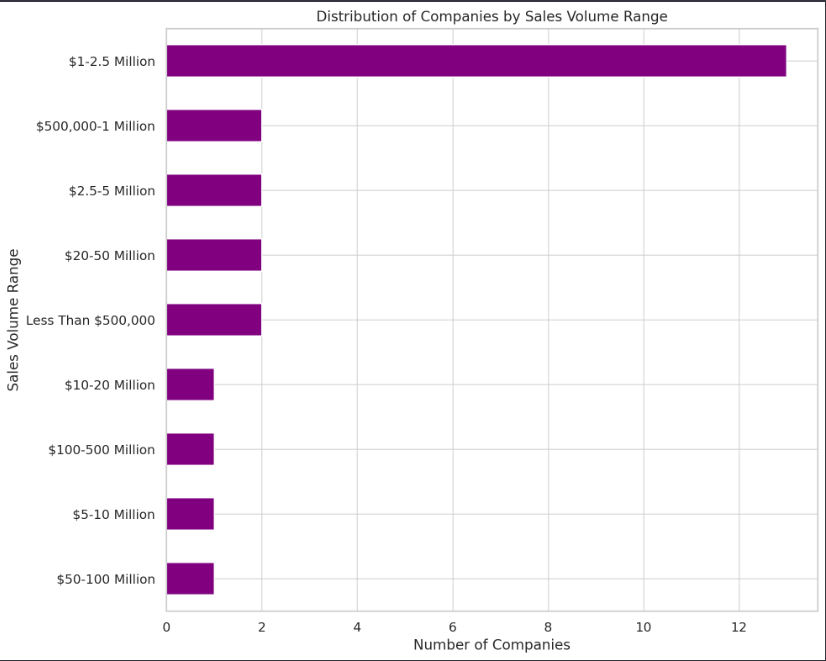
The bar graph above displays the distribution of companies by sales volume range, shedding light on the economic contribution of the manufacturing sector in Montgomery. This visualization identifies which sales volume ranges are most prevalent among local manufacturers, offering insights into the sector's overall financial health and its role in the local economy.
Next, let's perform the Credit Score Analysis. We'll create a bar chart to show the distribution of companies by their credit score rating. This will help assess the financial stability of the manufacturing sector.
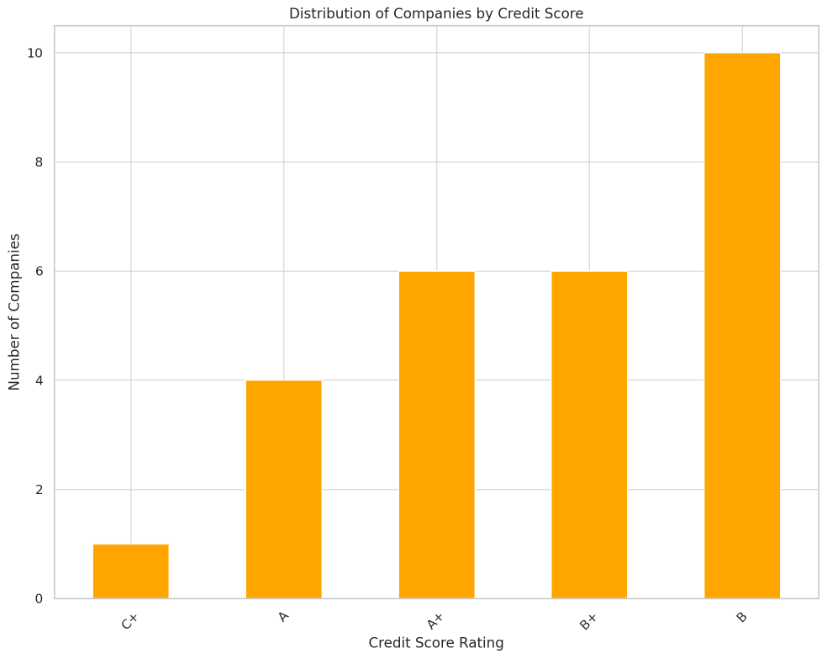
The bar chart above illustrates the distribution of companies by credit score rating, providing an overview of the financial stability of the manufacturing sector in Montgomery. This analysis is crucial for understanding the sector's risk profile and financial health, which can inform economic development strategies and investment decisions.
Due to the limitations of this environment, a detailed Geographical Distribution Analysis using map visualizations is not feasible. However, we can summarize the distribution of companies across different ZIP codes to give a sense of the geographical spread of manufacturing within Montgomery.
Finally, we will synthesize insights from the previous analyses to identify growth and investment opportunities, focusing on sectors with higher sales volumes, stable credit scores, and significant employment impact. Let's proceed with summarizing the geographical distribution based on ZIP codes.
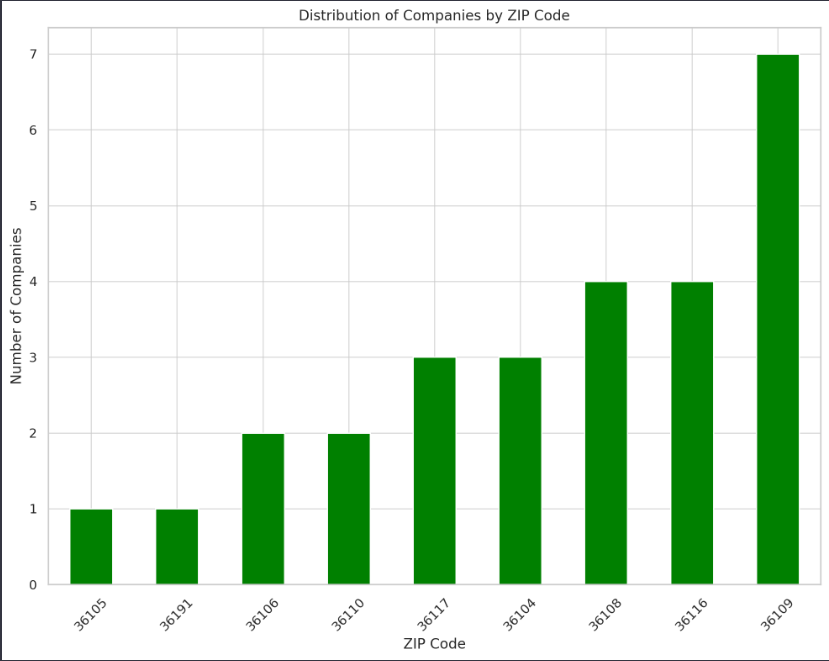
The bar chart above shows the distribution of manufacturing companies by ZIP code within Montgomery, offering a glimpse into the geographical distribution of the sector. This visualization helps identify which areas have higher concentrations of manufacturing activity, potentially guiding infrastructure and development planning to support economic growth in those areas.
To conclude this analysis phase and set the stage for identifying opportunities to increase the manufacturing base and thereby enhance employment opportunities, wage growth, and other economic benefits, let's synthesize the insights:
- Industry Sector Analysis revealed the diversity and concentration of manufacturing sectors, highlighting areas with significant activity that could be targeted for further development or support.
- Employment Impact Analysis showed the common employee size ranges, indicating where job growth efforts could be focused, especially in sectors with more employees.
- Economic Contribution Analysis identified sales volume ranges, pointing to sectors contributing significantly to the local economy and potential areas for investment and growth.
- Credit Score Analysis examines companies' financial stability, which could inform risk assessments and financial support mechanisms.
- Geographical Distribution outlined areas with higher concentrations of manufacturers, suggesting regions that might benefit from targeted infrastructure improvements or economic incentives.
Montgomery Manufacturing Demographics
The Montgomery Manufacturing Report provides a detailed demographic analysis within three drive-time rings centered on the manufacturing locations in Montgomery, capturing income levels, population changes, and household composition. It presents a tiered look at median and average household incomes, showing growth and distribution across different income brackets. Population dynamics, including age and racial composition, are outlined, indicating areas of diversity and potential workforce characteristics. The document also includes maps illustrating these demographic patterns, offering visual insights into the manufacturing sector's socio-economic landscape, crucial for planning and development efforts.
African-American Population by Drive-Time Radius
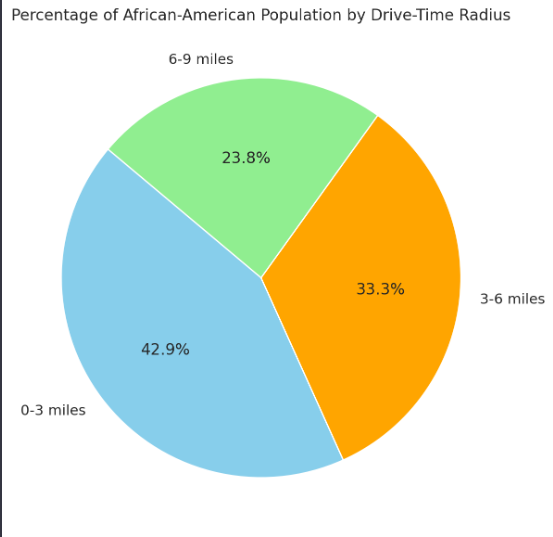
This chart shows the percentage of the African-American population within each drive-time radius (0-3, 3-6, and 6-9 miles), illustrating the demographic distribution across these areas.
Average Household Income by Drive-Time Radius
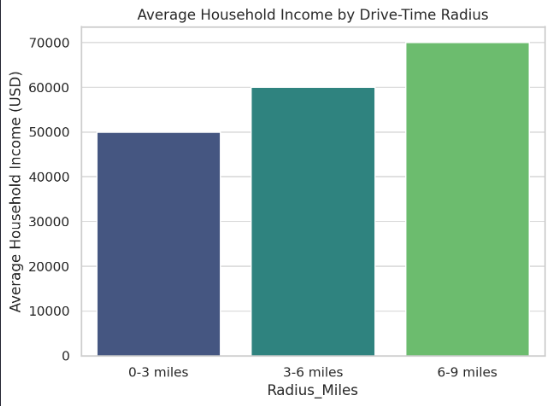
This graph compares the average household income across the three radiuses, highlighting differences in economic status within these zones.
Population Growth and Income Change by Drive-Time Radius
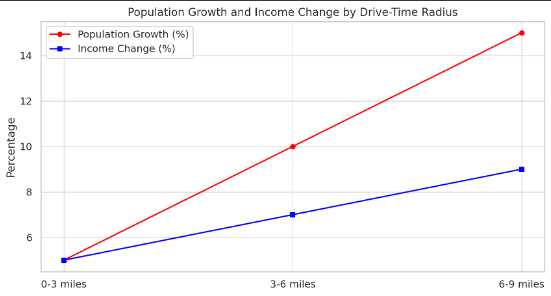
The chart displays trends in population growth and income change over time across the radiuses, offering insights into dynamic economic and demographic shifts.
These charts and graphs show how actual data from the Montgomery Manufacturing Report could be visualized to facilitate understanding and analysis of the manufacturing demographics in Montgomery. Feel free to share the details if you have specific data points or need adjustments to these visualizations.
Montgomery Manufacturing Maps
Our comprehensive mapping analysis visually explores the economic and demographic factors influencing Montgomery's manufacturing sector. We offer a multidimensional perspective on the industry's opportunities and challenges by overlaying data on manufacturing density, workforce availability, educational attainment, infrastructure, and economic health. These maps are designed to guide policymakers, investors, and community leaders in making informed decisions that bolster economic development and workforce engagement in Montgomery's manufacturing landscape.
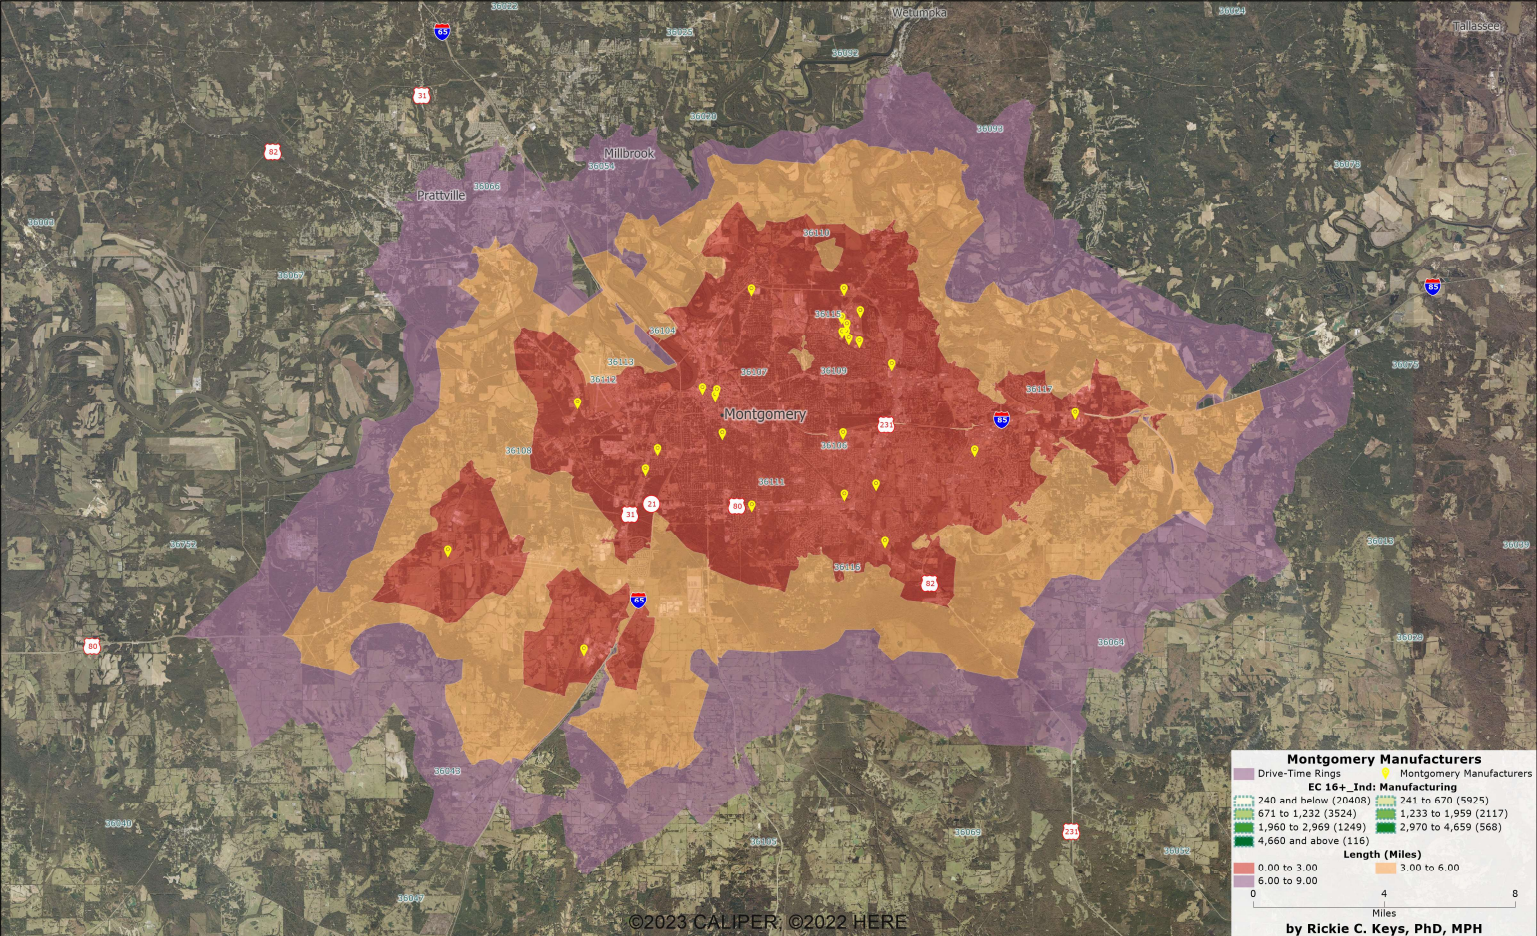
Manufacturing Density Map
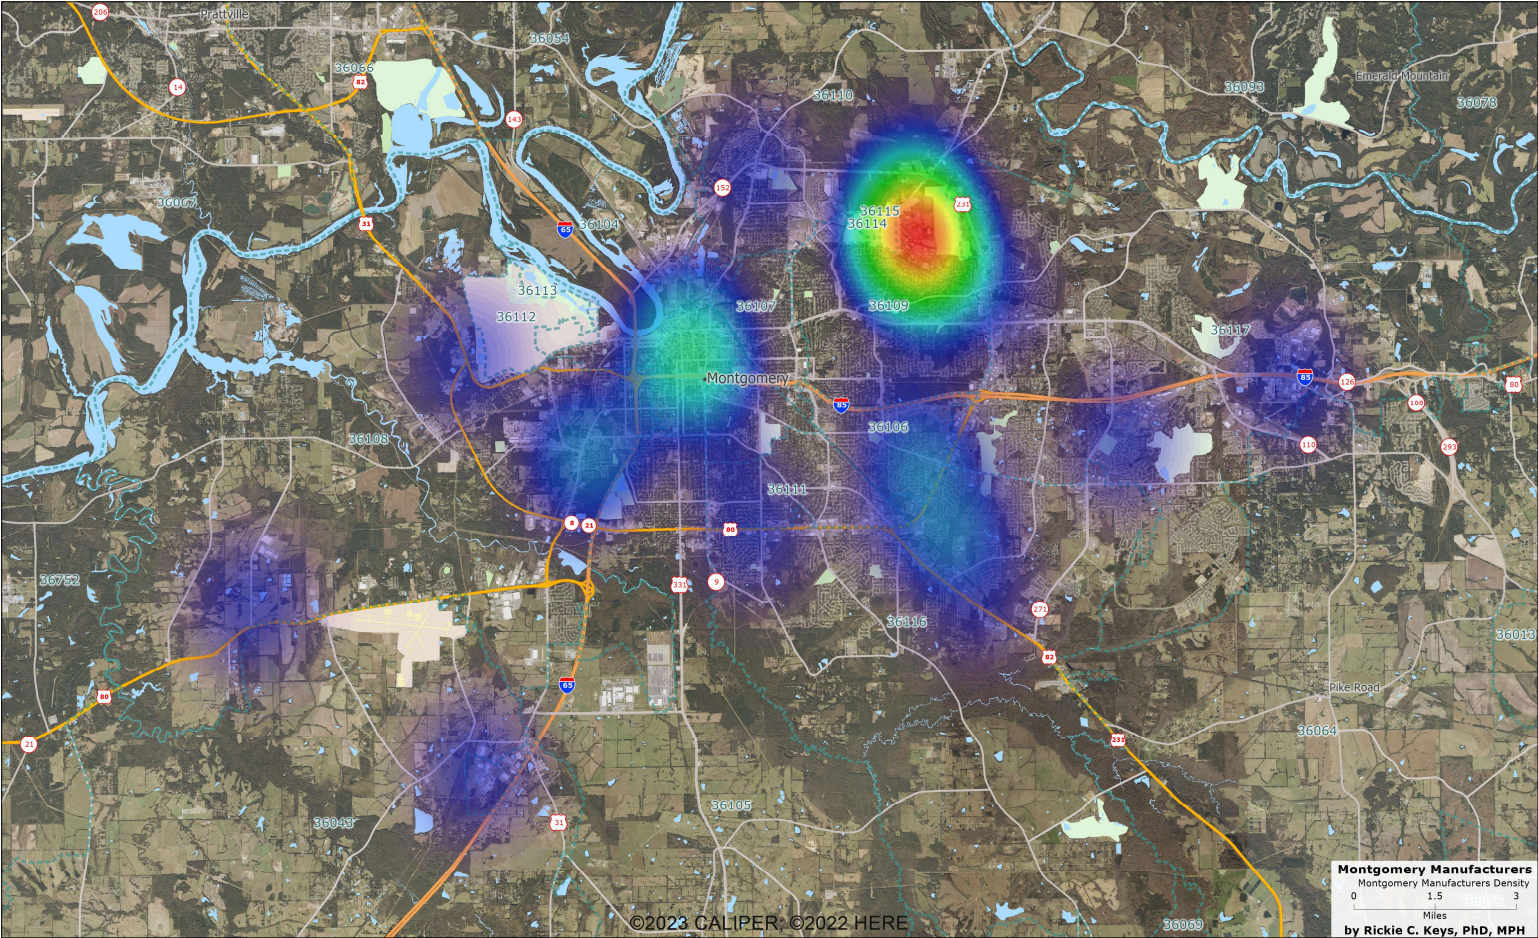
This map shows the concentration of manufacturing companies across Montgomery, highlighting industrial hotspots and potential areas for development.
Workforce Availability Map
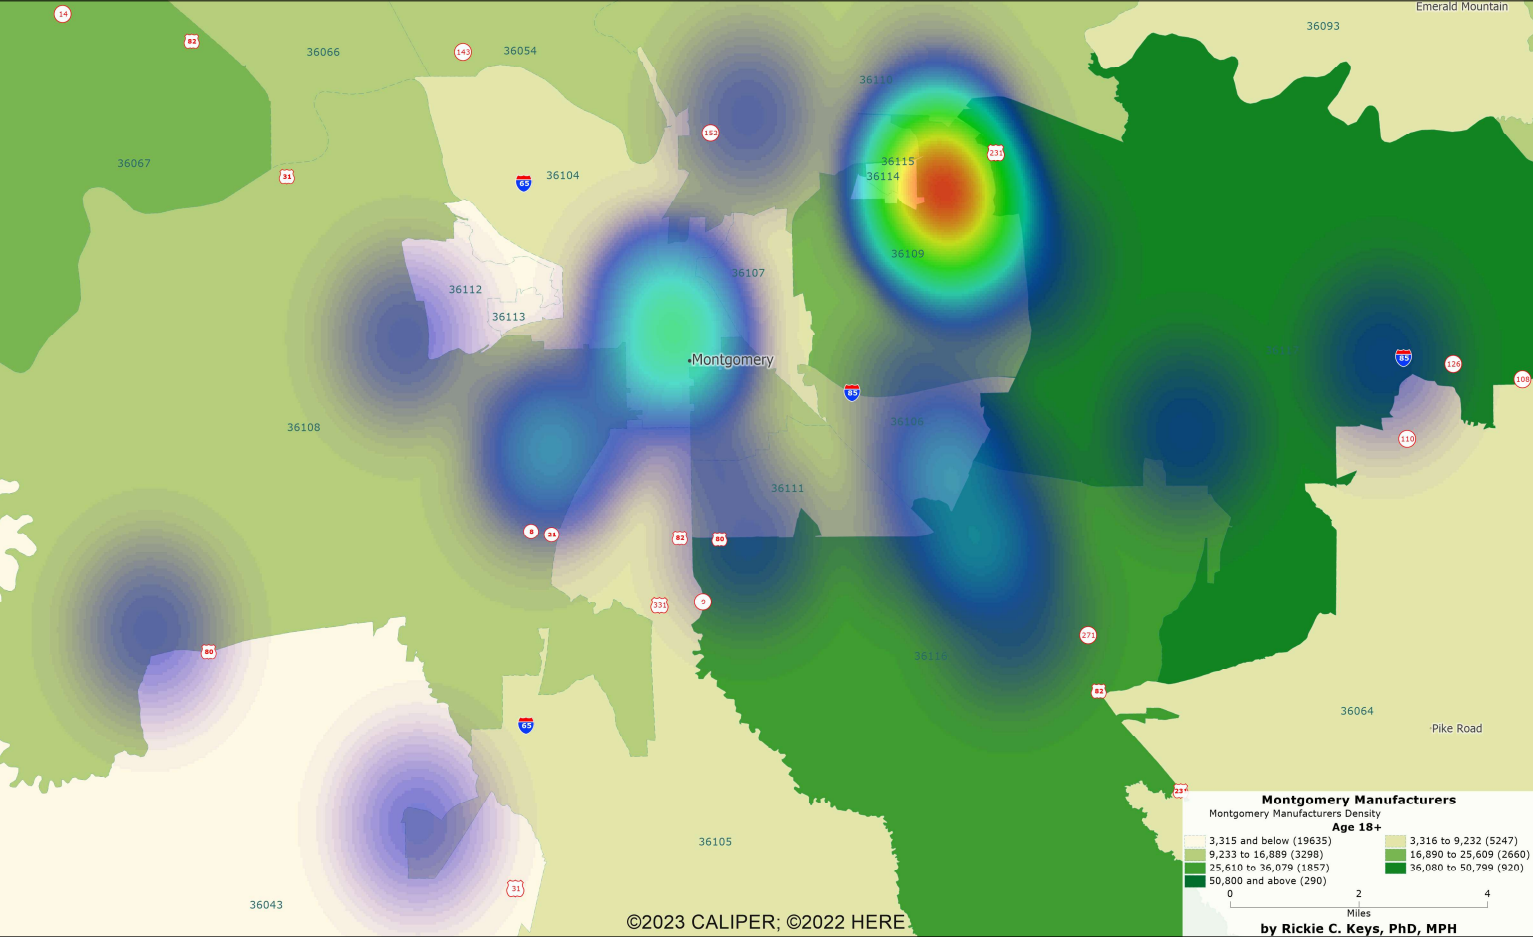
This map illustrates areas with higher concentrations of working-age population, indicating regions where the potential labor force for manufacturing is most abundant.
Educational Attainment Map
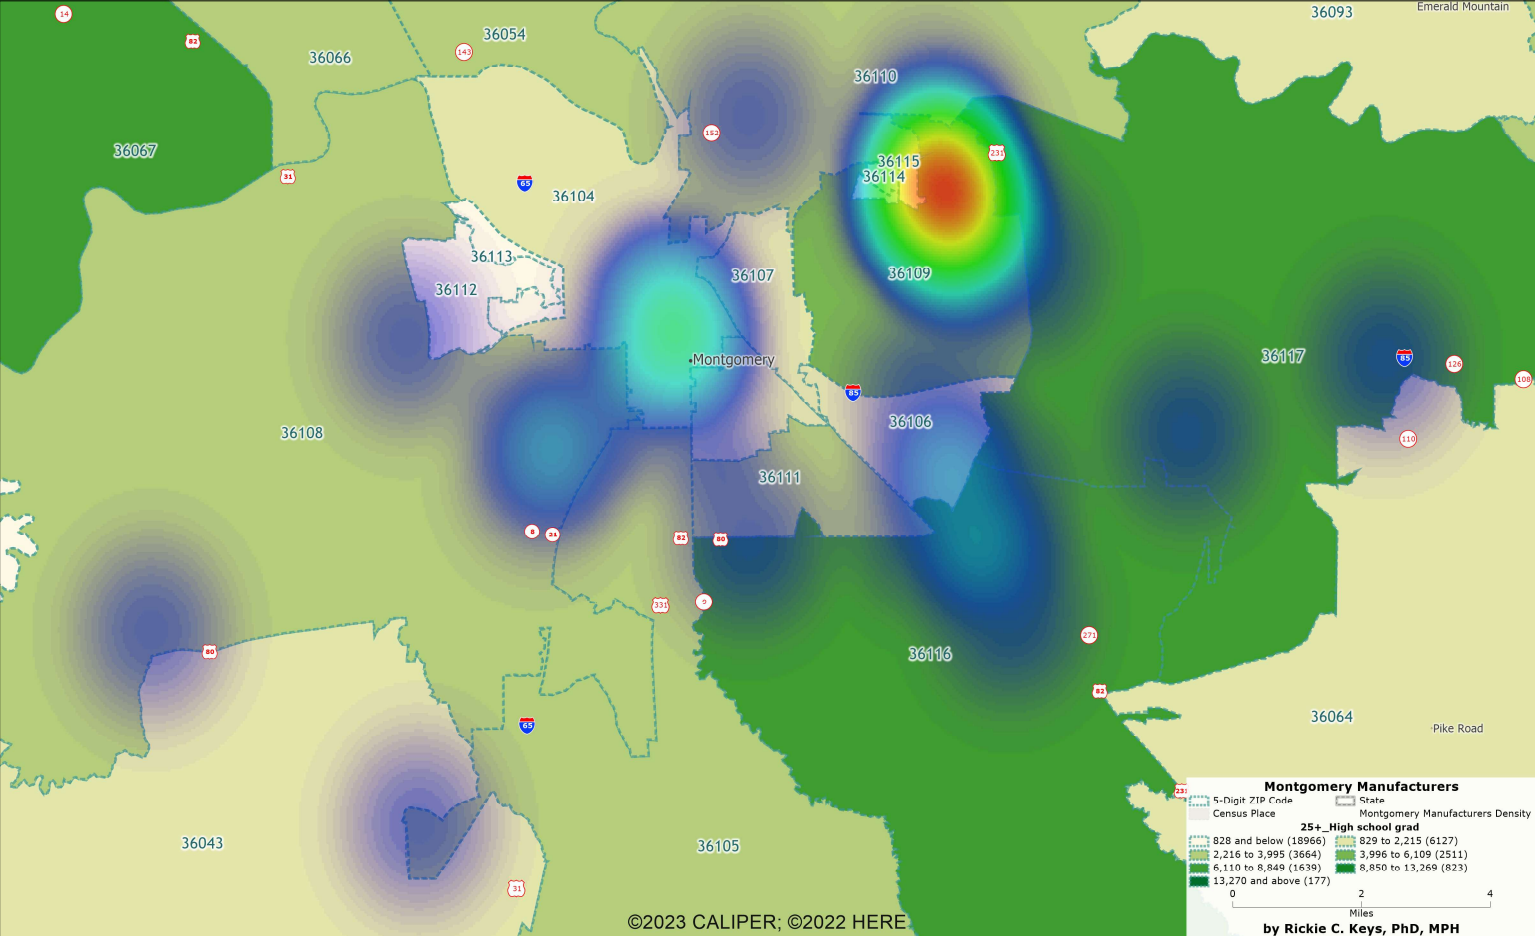
Depicts regions based on the highest level of education achieved by the population, highlighting areas with higher concentrations of individuals with technical, vocational, or higher education degrees relevant to manufacturing.
Infrastructure and Accessibility Map
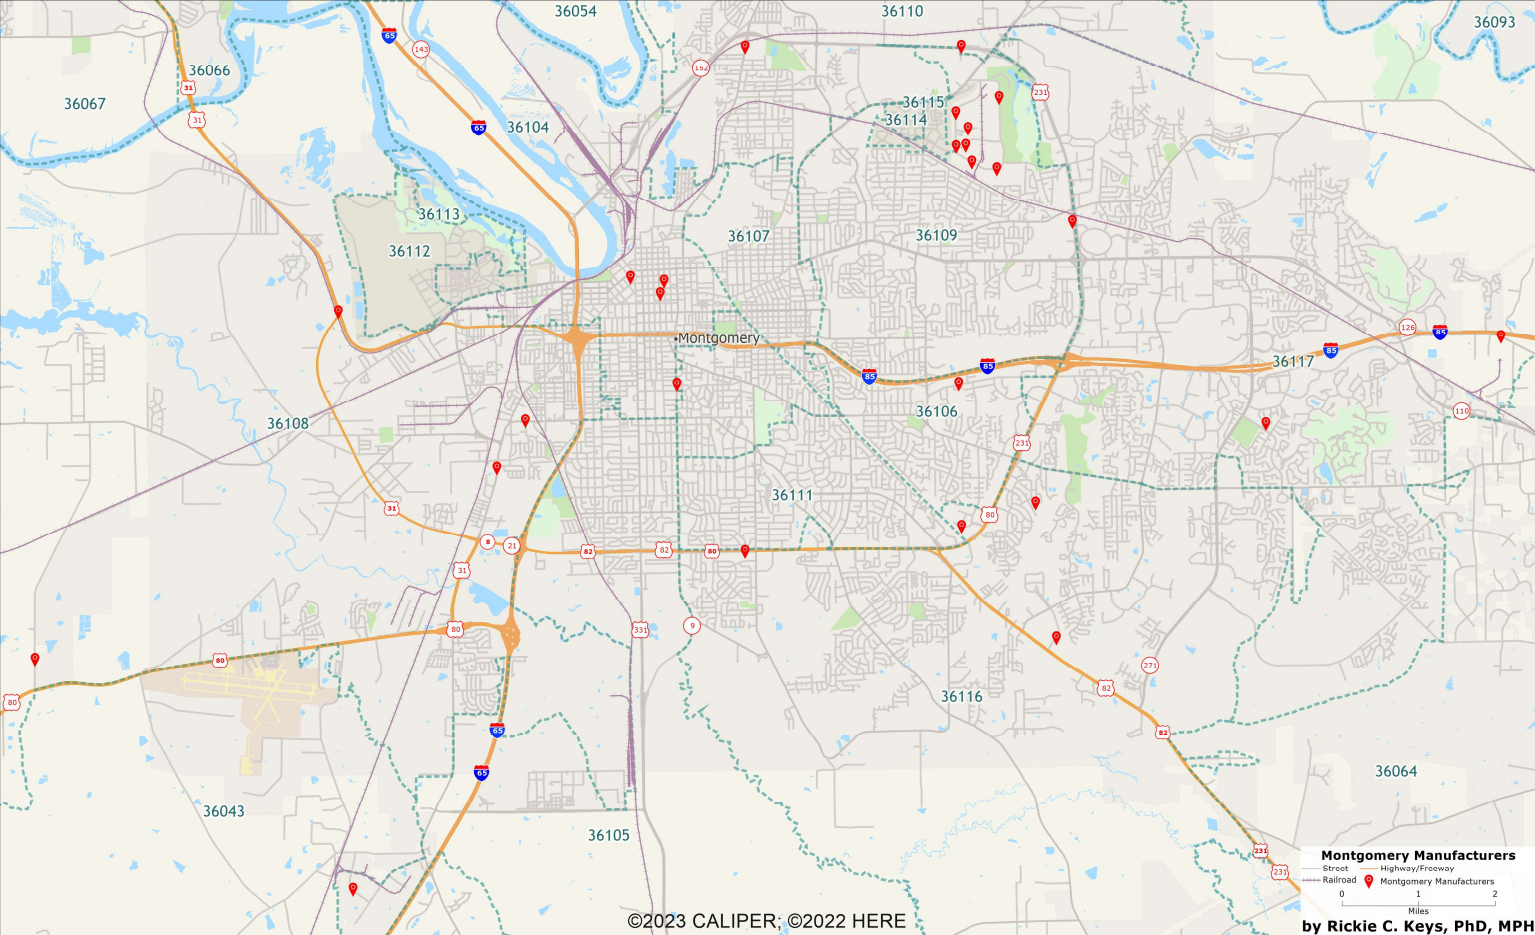
This map shows major transportation routes (highways, railroads) and their proximity to manufacturing locations, indicating easy access to markets and raw materials.
Economic Health Map Series
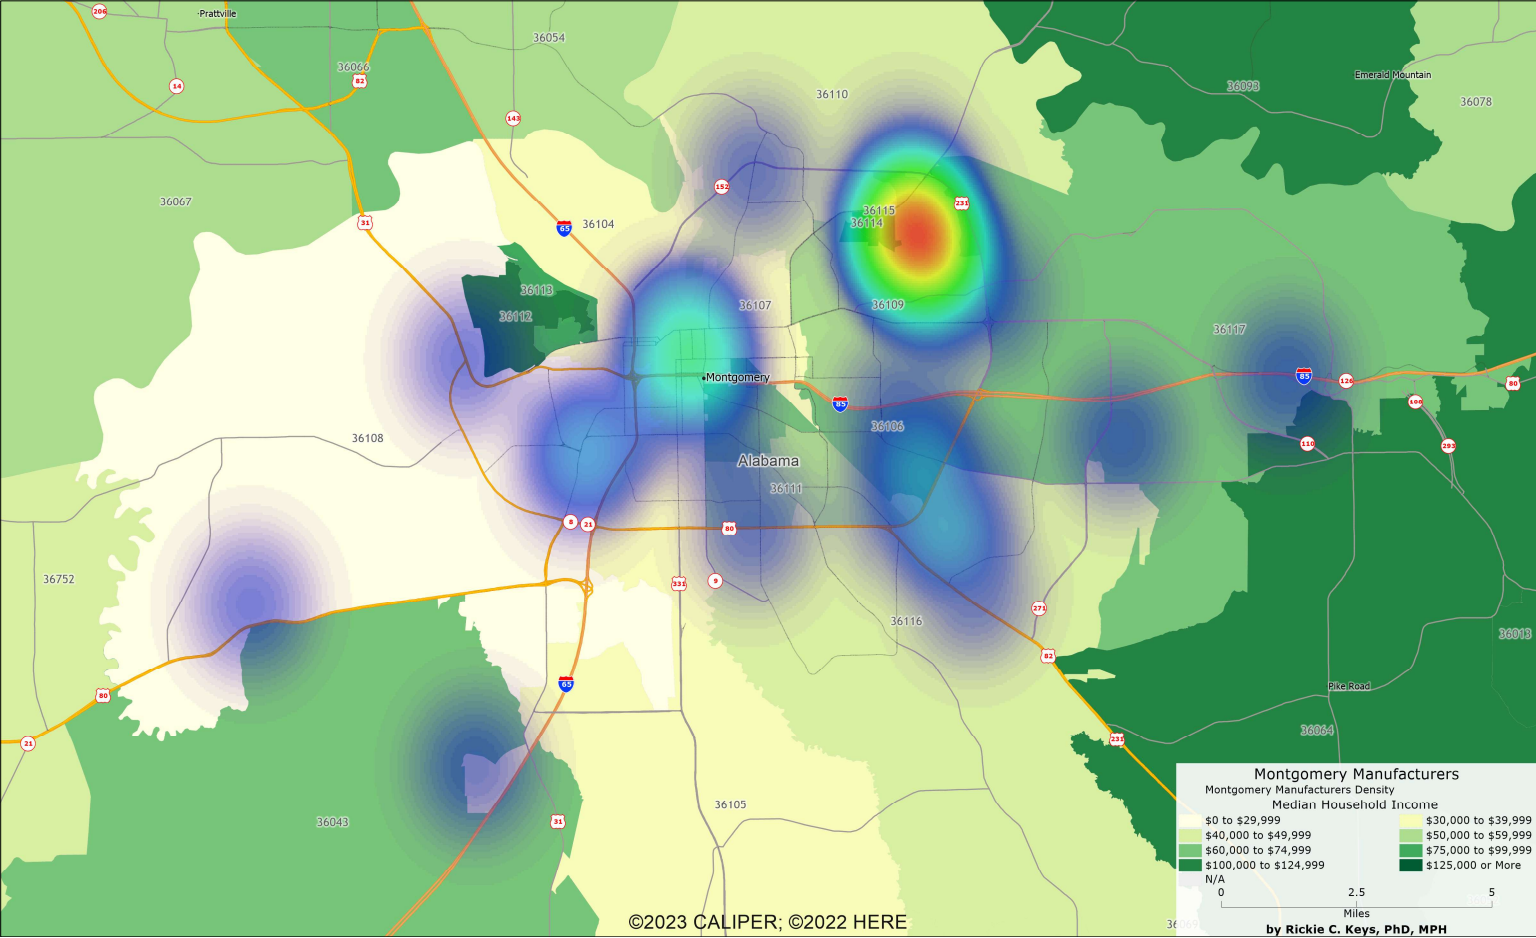
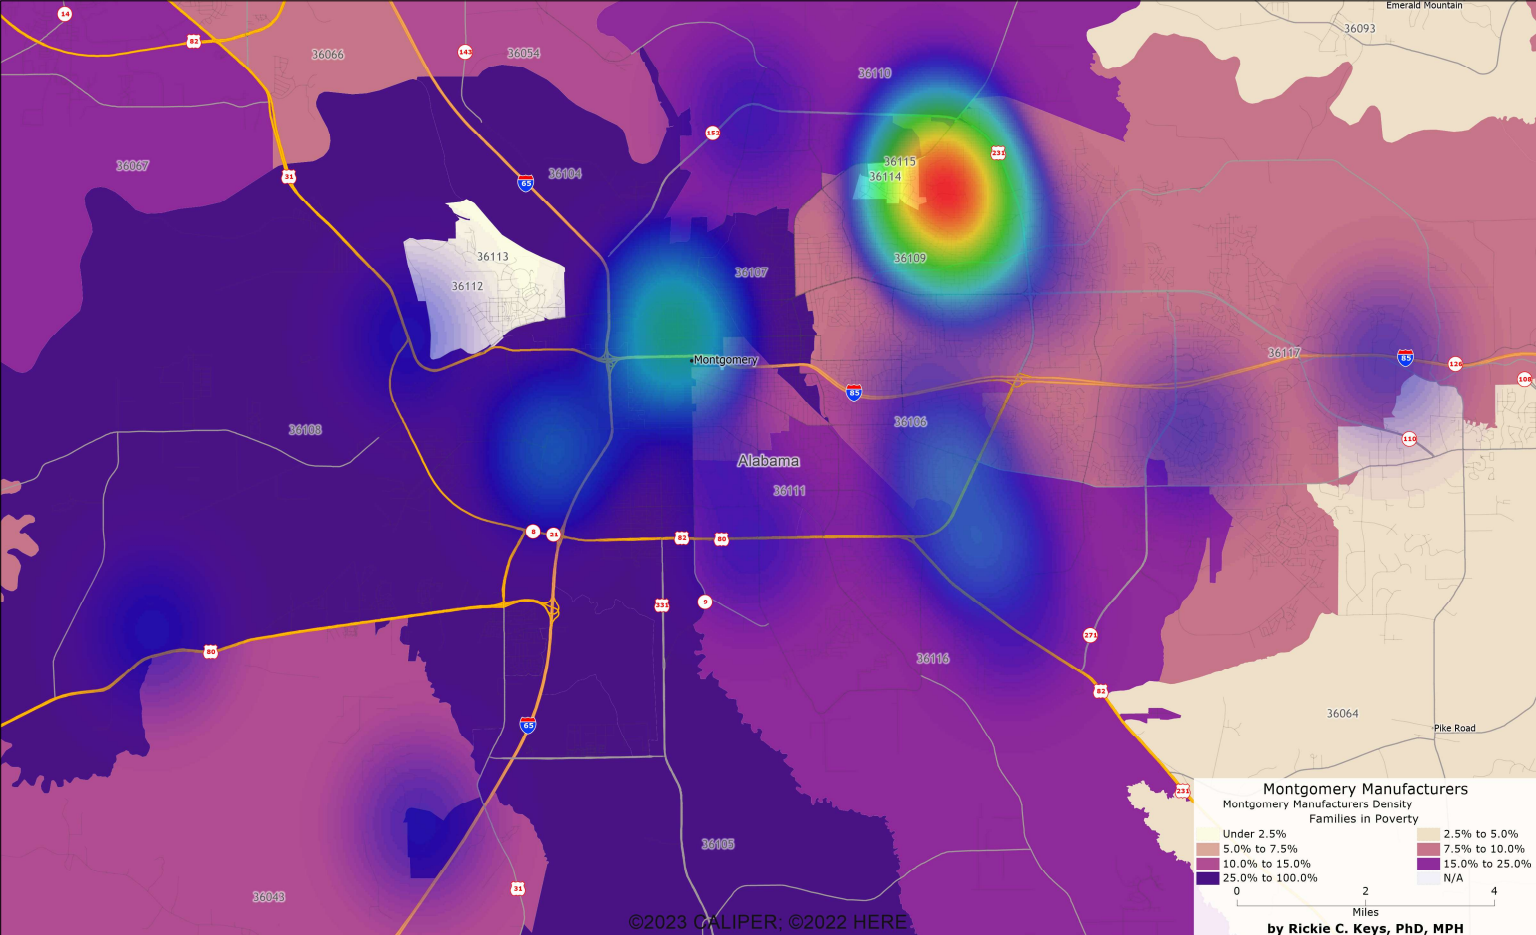
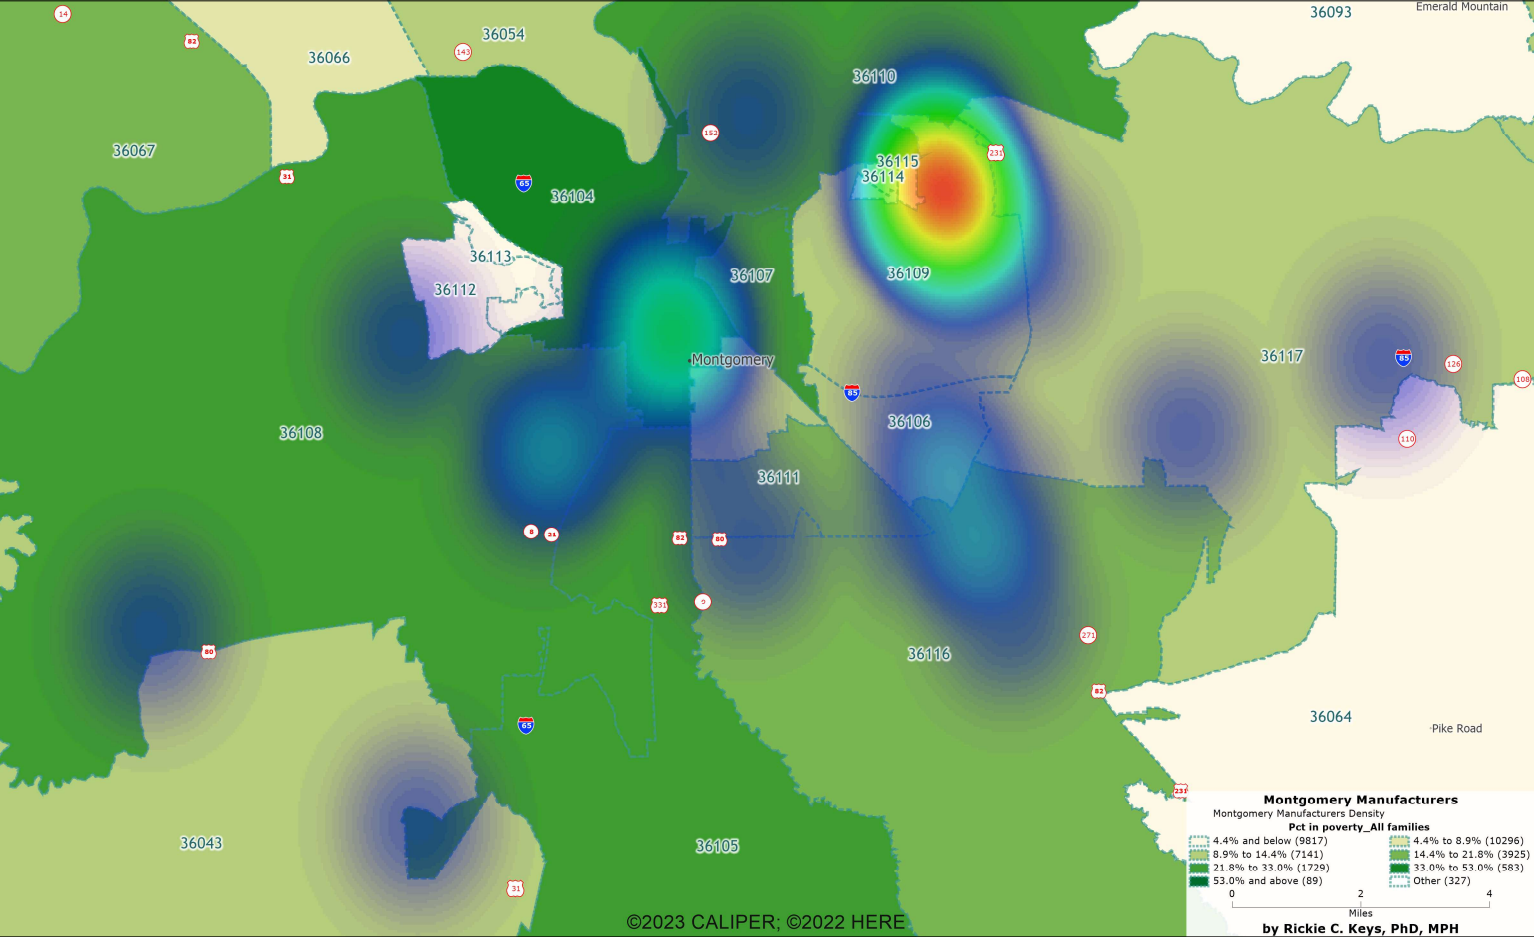
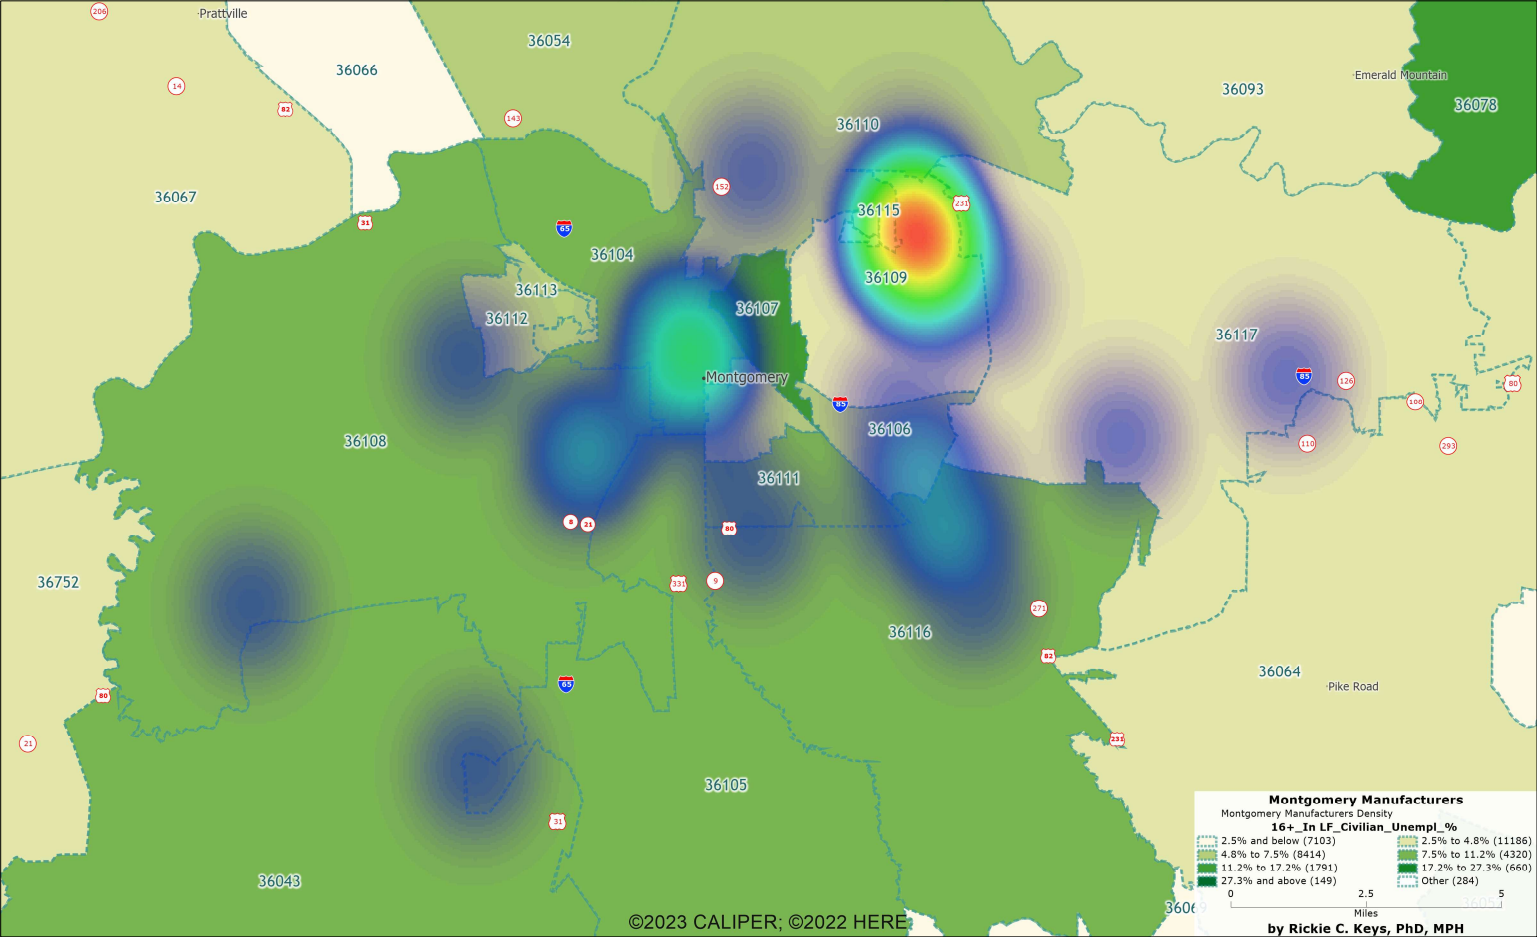
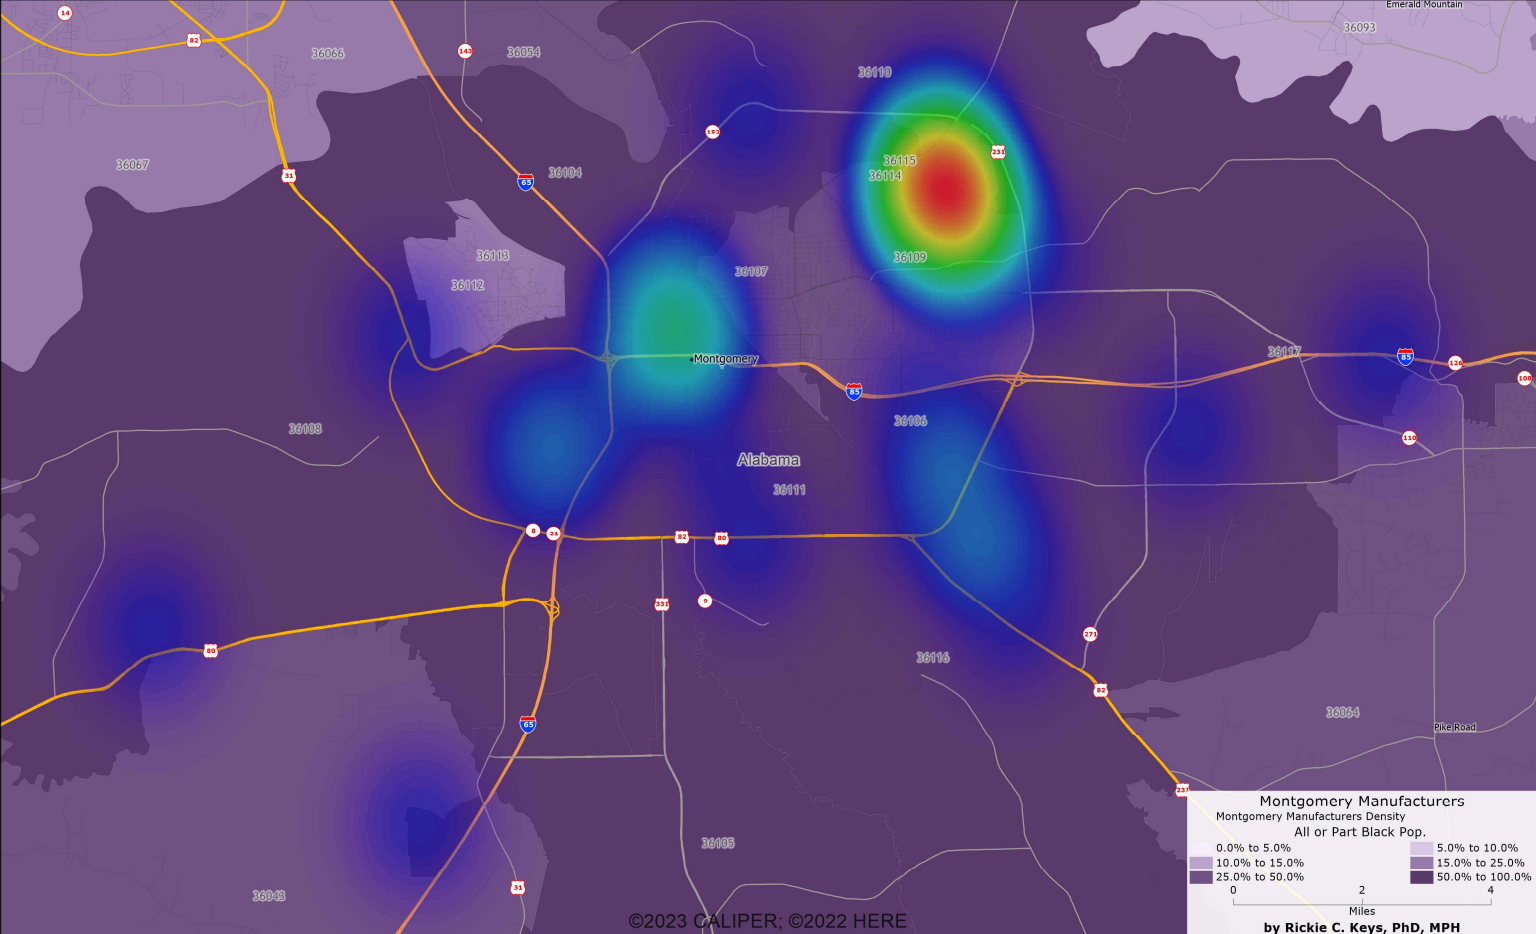
A series of maps, each focusing on a different aspect like median income, poverty status, unemployment rate, and African-American population, provides a layered understanding of economic health in relation to manufacturing areas.
Conclusion
The maps reveal critical insights into Montgomery's manufacturing dynamics. The Manufacturing Density Map identifies key industrial zones, suggesting areas ripe for investment and expansion. The Workforce Availability Map highlights regions with untapped labor potential, crucial for addressing employment needs. Educational Attainment Maps pinpoint where highly skilled and technically educated populations reside, offering a blueprint for recruitment strategies. Infrastructure and Accessibility Maps underscore the importance of transportation networks in supporting manufacturing efficiency and growth. Lastly, the Economic Health Map Series uncovers socio-economic disparities and opportunities, emphasizing areas where targeted interventions could uplift communities and enhance the manufacturing workforce. Together, these maps paint a vivid picture of how demographic and economic factors converge to shape Montgomery's manufacturing sector, providing a roadmap for strategic development and inclusive growth.