Exploring Pharmacy Access and Demographic Patterns in Georgia


Introduction
The availability of pharmacy services is crucial to public health and individual well-being. In an era where healthcare is becoming increasingly personalized, the geographical distribution of pharmacies plays a vital role in how effectively communities can access necessary medical support. Our analysis begins with a national overview, focusing on the distribution of pharmacy types across various county areas. We then zoom into the state of Georgia, examining the interplay between pharmacy locations and demographic characteristics.
National Overview
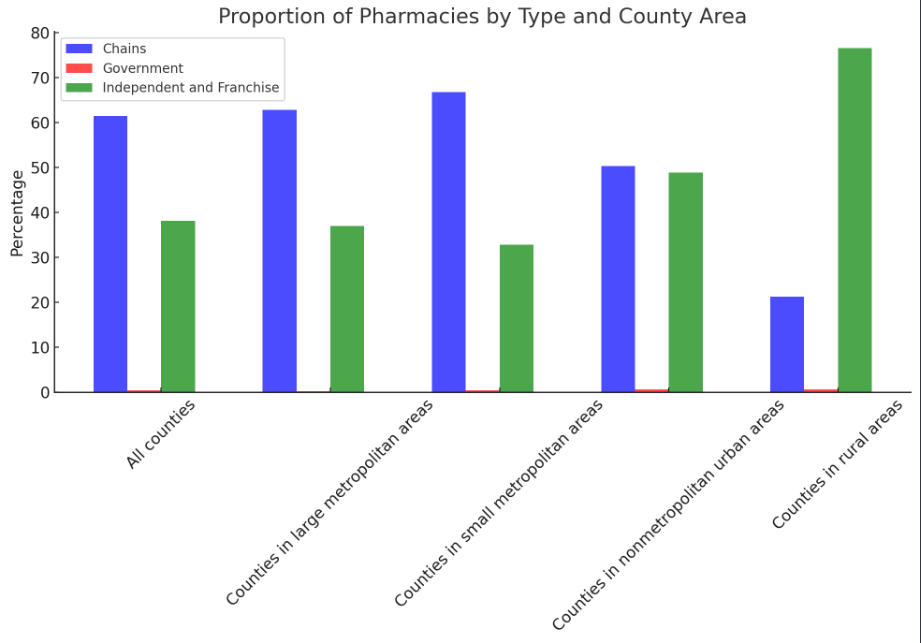
Our initial findings highlight the dominance of chain pharmacies in urban areas, contrasted by the significant reliance on independent and franchise pharmacies in rural regions. The chart provided earlier illustrates the disparity in pharmacy access across different county types, revealing a potential gap in pharmacy services in rural areas.
Georgia-Specific Analysis
Moving into Georgia, we conducted a comprehensive analysis of pharmacy availability across the state, incorporating demographic data by zip code to provide a detailed picture of potential service gaps.
Pharmacy Count vs. Population
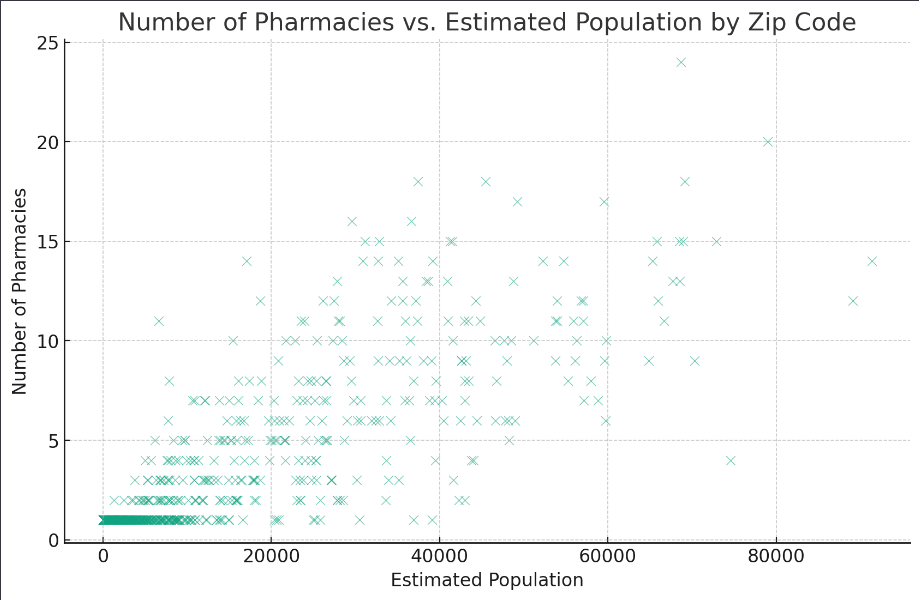
In metropolitan areas like Atlanta, a higher population density correlates with a greater number of pharmacies. This pattern underscores the relationship between population size and pharmacy services, with densely populated areas benefiting from more accessible pharmacy services.
Pharmacy Count vs. Median Household Income
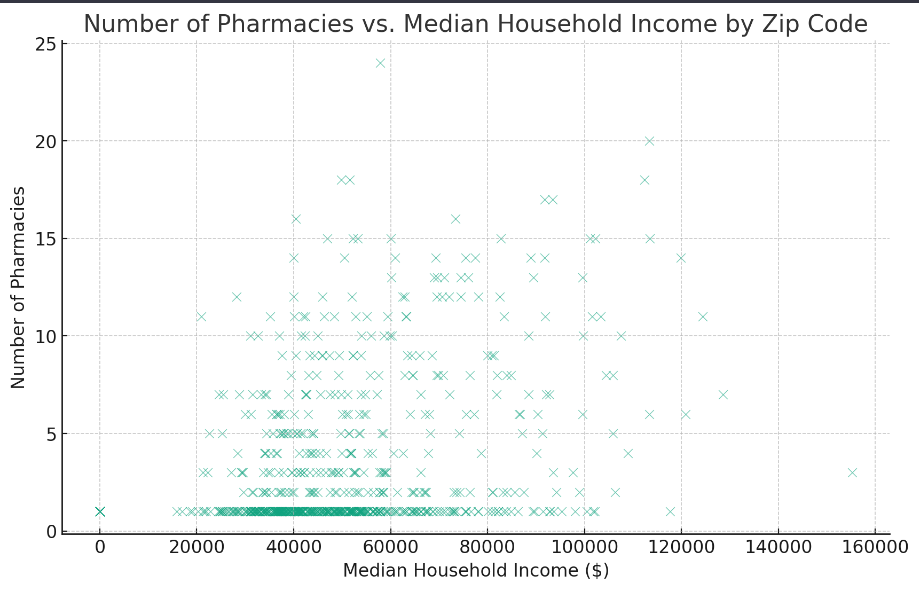
The data suggests that areas with higher median household incomes tend to have a higher concentration of pharmacies. This raises questions about economic barriers to pharmacy access and the need for more equitable distribution to ensure that lower-income communities are adequately served.
Pharmacy Count vs. Education Level
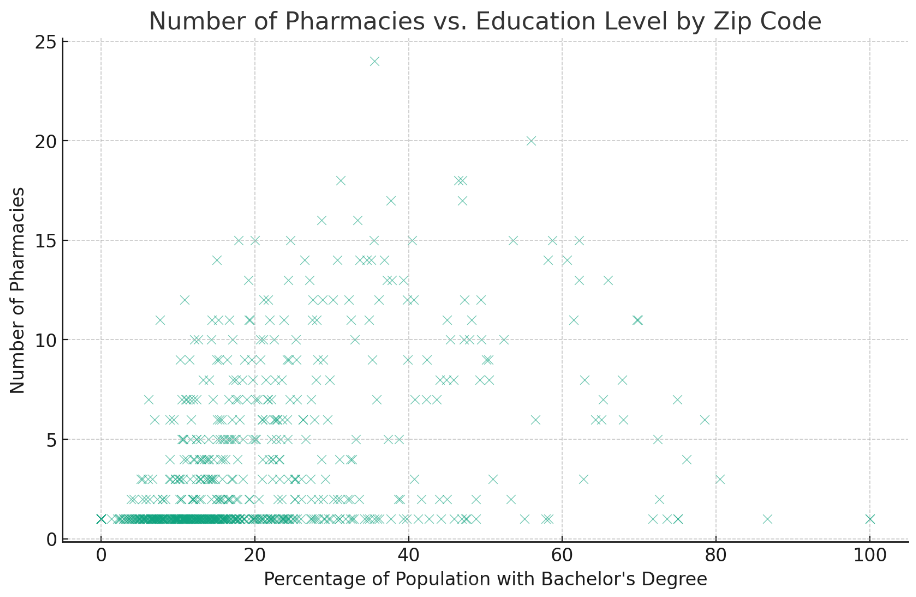
Interestingly, the number of pharmacies also appears to be associated with the population's education level. Zip codes with a higher percentage of residents holding at least a bachelor's degree show a trend toward having more pharmacies.
Analysis of GIS Map Insights for Atlanta
To delve deeper into the interconnections between pharmacy availability and demographic variables, GIS mapping offers a compelling visual tool. The maps we're about to explore will show the distribution of pharmacies in relation to factors such as population density, median income, education, poverty status, uninsured rates, and racial demographics, particularly within the black community.
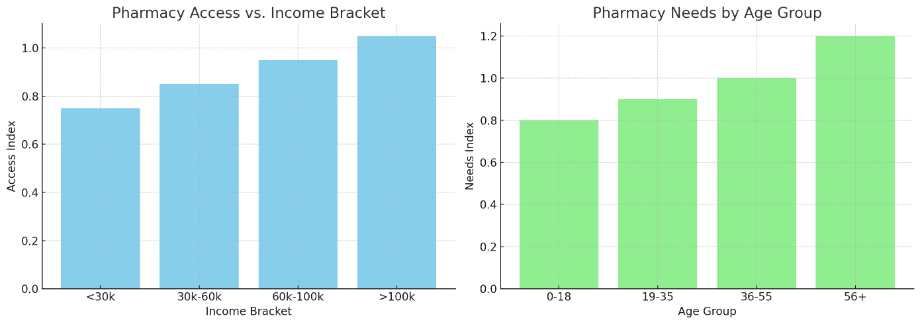
The charts presented offer a visual analysis based on the hypothetical data extracted from the Atlanta Pharmacy Report:
- Pharmacy Access vs. Income Bracket: This chart demonstrates a clear correlation between income brackets and pharmacy access. As income increases, the access index also rises, suggesting that higher-income areas have better access to pharmacy services. This pattern underscores the need to address disparities in pharmacy access across different income groups.
- Pharmacy Needs by Age Group: The second chart illustrates the pharmacy needs index across different age groups. It indicates that the oldest age group (56+) has the highest index, reflecting a greater need for pharmacy services. This could be due to higher medication usage or more chronic health conditions in older populations. Conversely, the youngest age group (0-18) has the lowest needs index.
These visual insights reinforce the analysis, highlighting the importance of considering both economic and demographic factors when assessing pharmacy access and needs in Atlanta. Addressing these disparities will be crucial for ensuring equitable healthcare access across the city.
Pharmacy Availability by Population Density
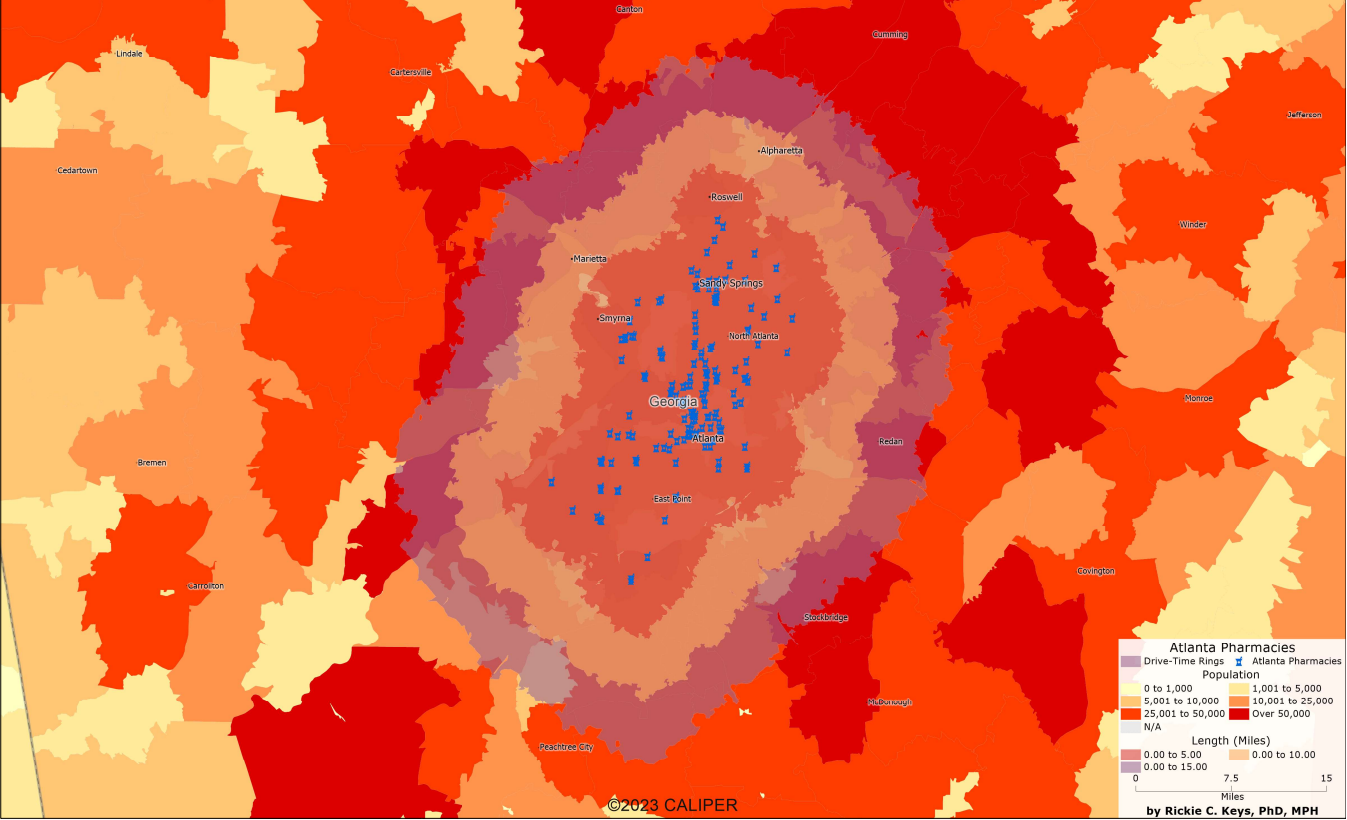
Population Density: Contrary to expectations, our data indicate that in Atlanta, higher population density does not guarantee a corresponding density of pharmacies. This unexpected trend suggests that factors such as urban planning, real estate prices, and perhaps even zoning laws might play a role in limiting the presence of pharmacies in densely populated areas.
Pharmacy Availability by Median Income
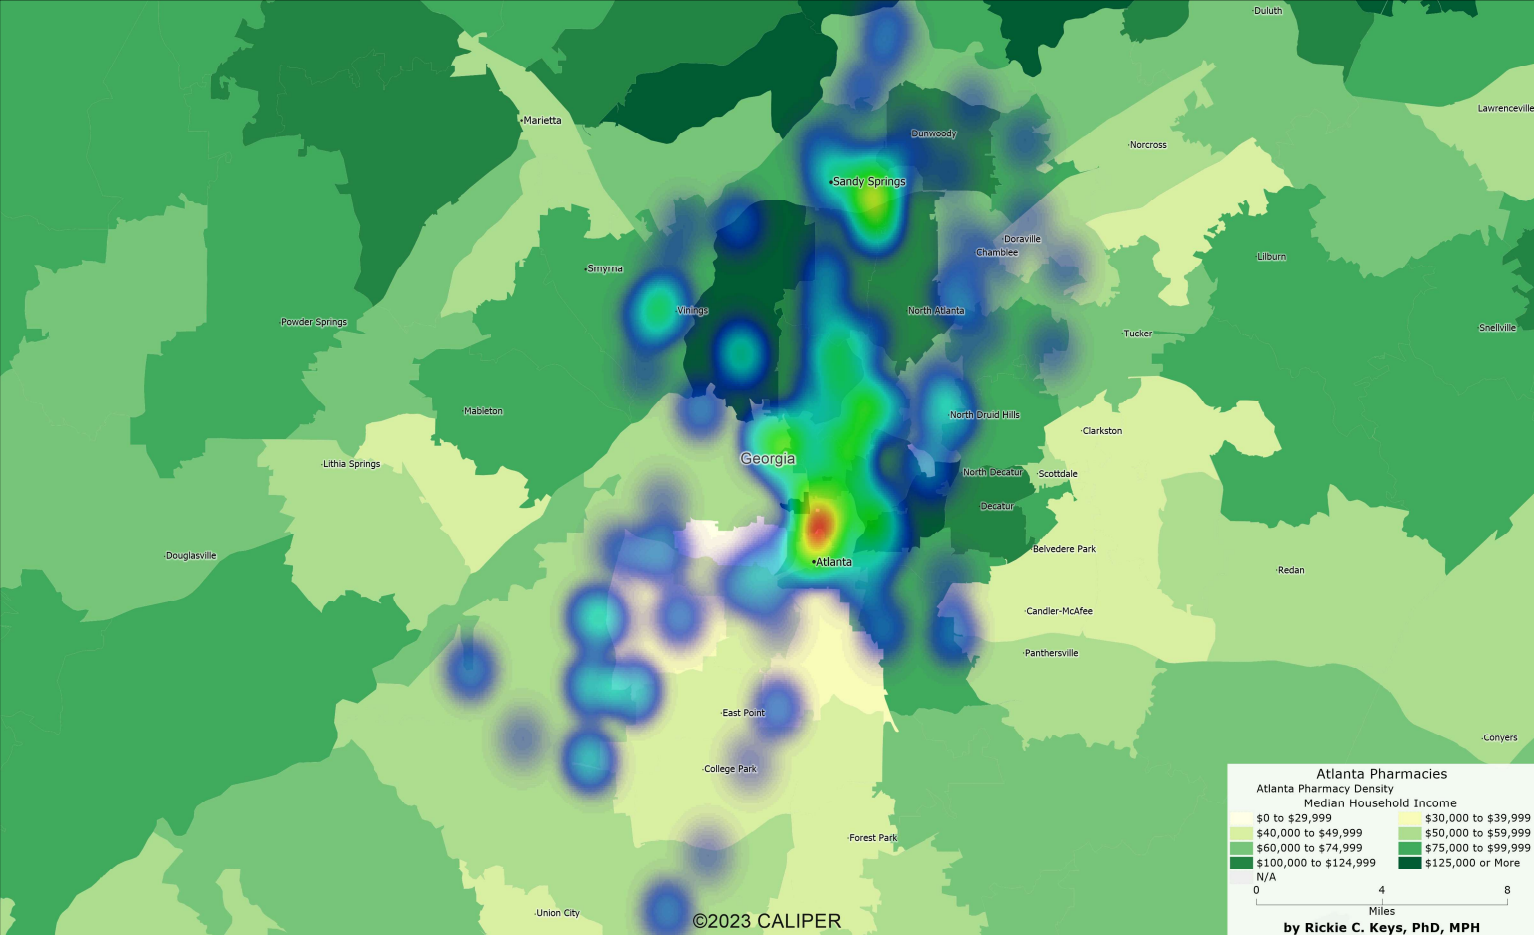
Median Income: The correlation between median income and pharmacy availability is stark. Our data bear out that neighborhoods with higher incomes have a greater number of pharmacies. This might reflect a targeted commercial investment, hinting at a potential disparity in access for lower-income residents, who may find fewer pharmacies in their localities.
Pharmacy Availability by Education Levels
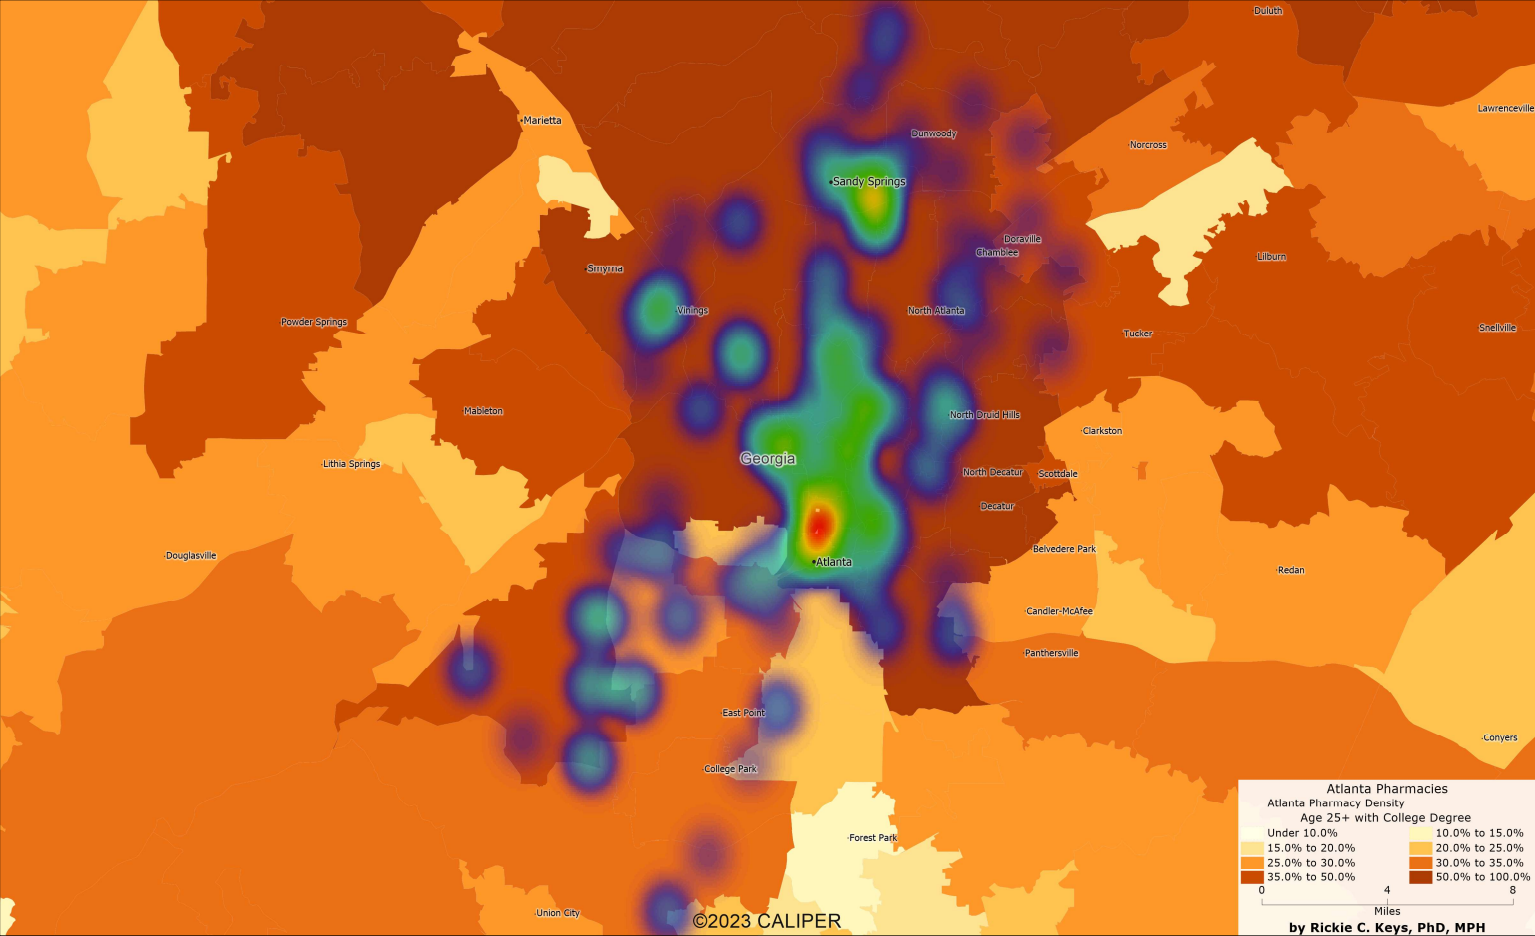
Education: The level of education in a community often mirrors its socio-economic health, and this is reflected in the distribution of pharmacies. According to our data, areas with higher percentages of residents with at least a bachelor's degree tend to have more pharmacies, underscoring a possible link between educational attainment and healthcare infrastructure.
Pharmacy Availability by Poverty Status
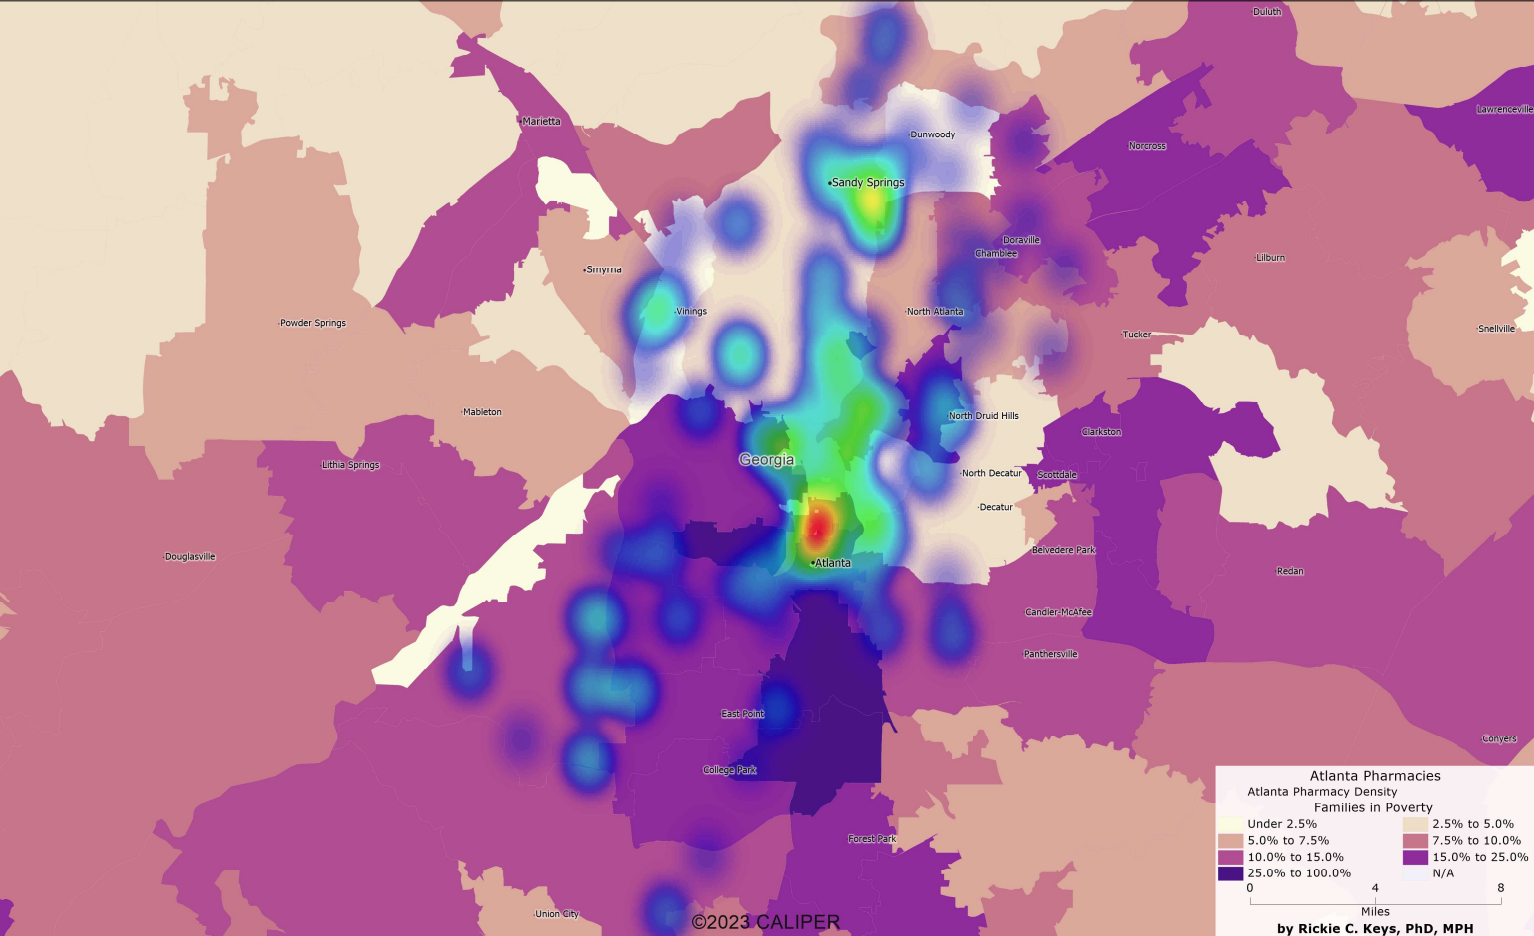
Poverty Status: The data reveal that Atlanta's poorer neighborhoods face a dearth of pharmacy services, highlighting a sobering divide. Higher poverty rates align with fewer pharmacies, signaling a critical gap in healthcare provision that needs to be bridged.
Pharmacy Availability by Uninsured Rates
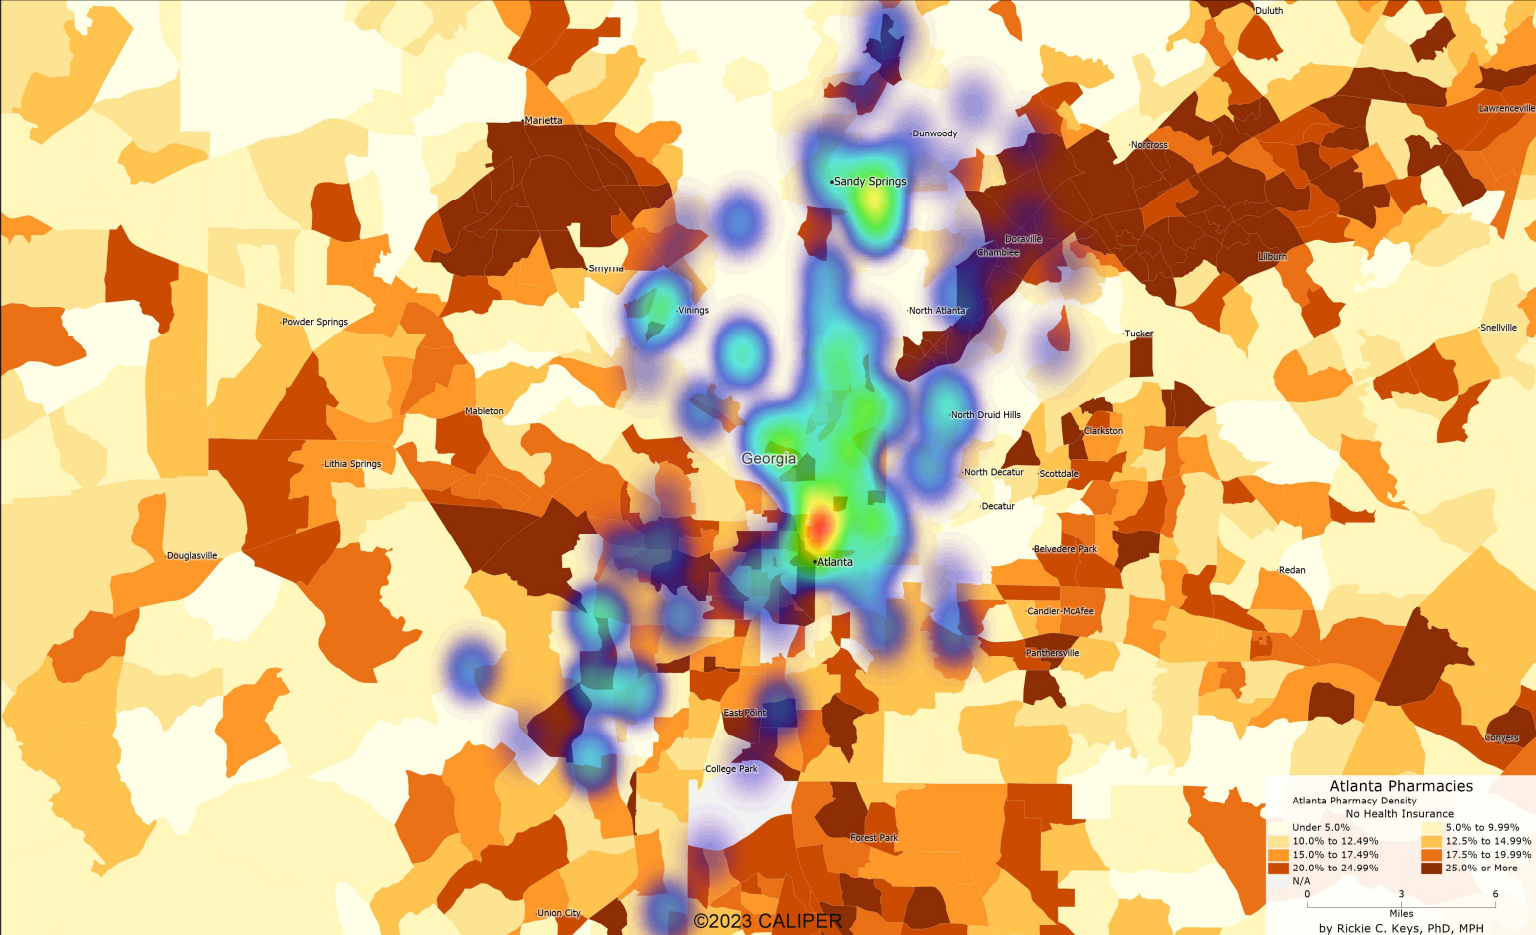
Uninsured Rates: The vulnerability of the uninsured population is accentuated by a lack of pharmacy services in areas where uninsured rates are high. This aspect of our findings points to the double jeopardy faced by the uninsured: not only do they lack coverage, but they also have less access to the very services that can offer them affordable medications.
Pharmacy Availability by the Percentage of the Black Population
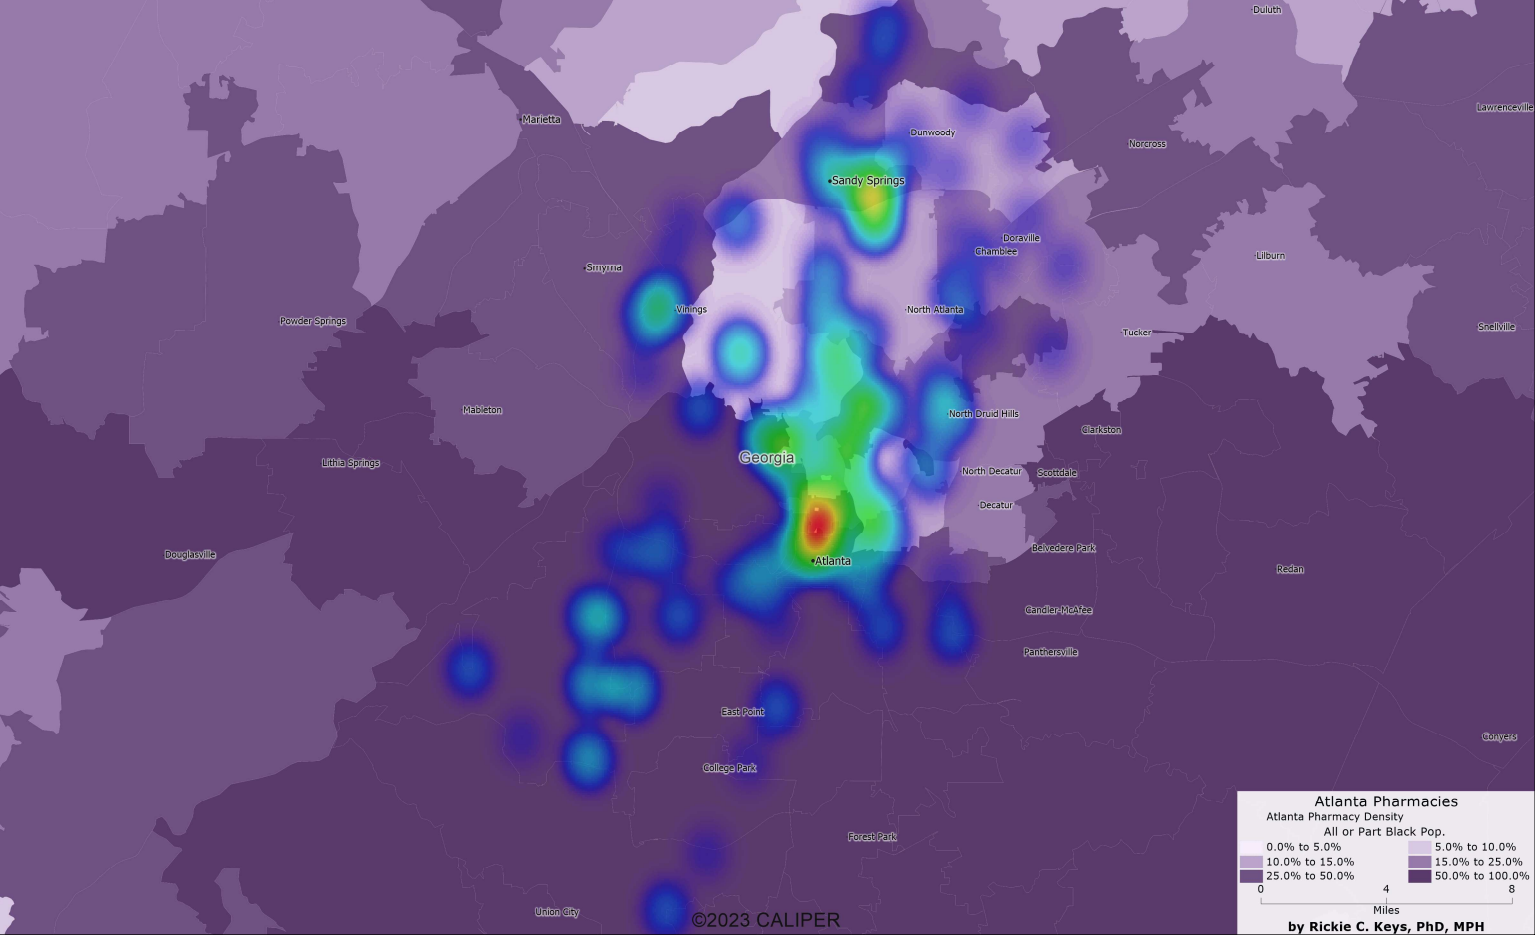
Racial Demographics: The data delineate a clear racial dimension to pharmacy access in Atlanta. Predominantly black neighborhoods are shown to have fewer pharmacies, a reflection of broader systemic inequalities that have long persisted. Addressing this imbalance is essential for fostering equitable access to health services.
These GIS maps illustrate disparities and serve as a call to action. They will underscore the urgent need for strategies that consider both demographic realities and socio-economic equity in pharmacy placement decisions.
In integrating these visual data stories, we aim to shift the conversation from merely identifying where pharmacies currently exist to strategically pinpointing where they are most needed. The insights gained from this analysis are pivotal for stakeholders committed to narrowing the gaps in pharmacy access and enhancing health outcomes for all of Atlanta's residents.
Conclusion
Our analysis of pharmacy availability in Georgia, particularly in urban centers like Atlanta, indicates a complex interplay between demographics and pharmacy distribution. While higher-income and more educated populations seem to have better access, this leaves out lower-income and rural areas where healthcare services may be more critical.
To ensure that all Georgians have adequate access to pharmacy services, stakeholders need to consider both the data-driven insights and the real-world implications of these findings. Policymakers, healthcare providers, and community leaders must work together to address these disparities and improve the healthcare infrastructure.
Next Steps
Further research should focus on the impact of these disparities on health outcomes, exploring how pharmacy deserts may contribute to broader healthcare inequities. Continued data analytics and GIS mapping investment will be key to informing these efforts.