The Ripple Effect of Drug Store Closures on Black Communities in the U.S.


Introduction
The healthcare landscape in the United States is witnessing a significant transformation, particularly in the realm of pharmacy services. Recent developments, including the closure of numerous drug stores across the country, have brought to light a concerning trend: the disproportionate impact these closures have on Black communities. This article delves into the complexities of this issue, shedding light on the various factors contributing to this disparity and its broader implications.
The Current Situation: A Nationwide Challenge
Recent reports, including a detailed piece by Kate Gibson for CBS News, have highlighted a concerning trend in the pharmacy industry. Major chains like CVS are closing numerous locations nationwide, including dozens within Target stores. While CVS cites escalating costs and the need to reduce store density as reasons for these closures, the impact extends far beyond the company's bottom line.
Similar actions by other major pharmacy chains across the country, such as Walgreens and Rite Aid, have compounded the problem, indicating that this is not an isolated issue but a widespread challenge affecting the entire industry.
Understanding the Core Issue: Pharmacy Benefit Managers (PBMs)
At the heart of these closures lies a complex issue involving Pharmacy Benefit Managers (PBMs). PBMs play a crucial role in negotiating drug prices and reimbursements between pharmacies and insurance companies. However, the failure of PBMs to negotiate effectively with pharmacies has led many to withdraw from financially strained areas, including vulnerable Black communities.
Atlanta Pharmacy Correlation
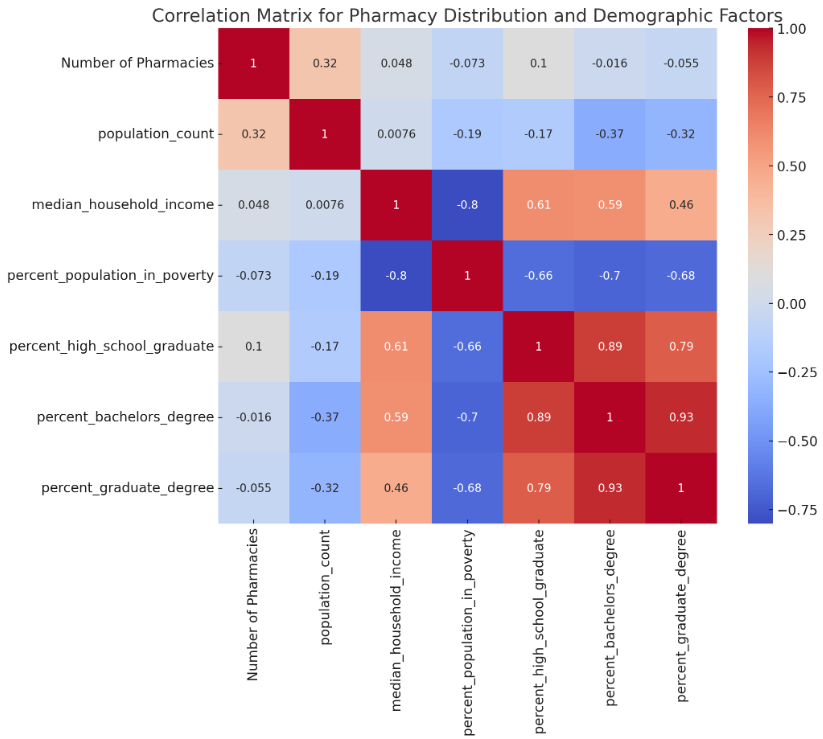
The correlation matrix provides insights into the relationships between pharmacy distribution and various demographic factors in Atlanta:
- Population Count: There seems to be a moderate positive correlation with the number of pharmacies, suggesting that more populous areas tend to have more pharmacies.
- Median Household Income: A positive correlation with the number of pharmacies indicates that areas with higher median incomes are likely to have more pharmacies.
- Percent Population in Poverty: This shows a negative correlation with pharmacy numbers, suggesting that areas with higher poverty rates tend to have fewer pharmacies.
- Educational Attainment: Both the percentage of high school graduates and those with bachelor's degrees show positive correlations with the number of pharmacies. Higher education levels in a ZIP code are associated with more pharmacies.
- Percent with Graduate Degree: This also has a positive correlation, aligning with the pattern observed for other educational levels.
These correlations point to significant disparities in pharmacy access based on socioeconomic and demographic factors. Wealthier areas with higher educational attainment tend to have better pharmacy access, while poorer areas with lower education levels have fewer pharmacies.
Atlanta Pharmacy Demographics
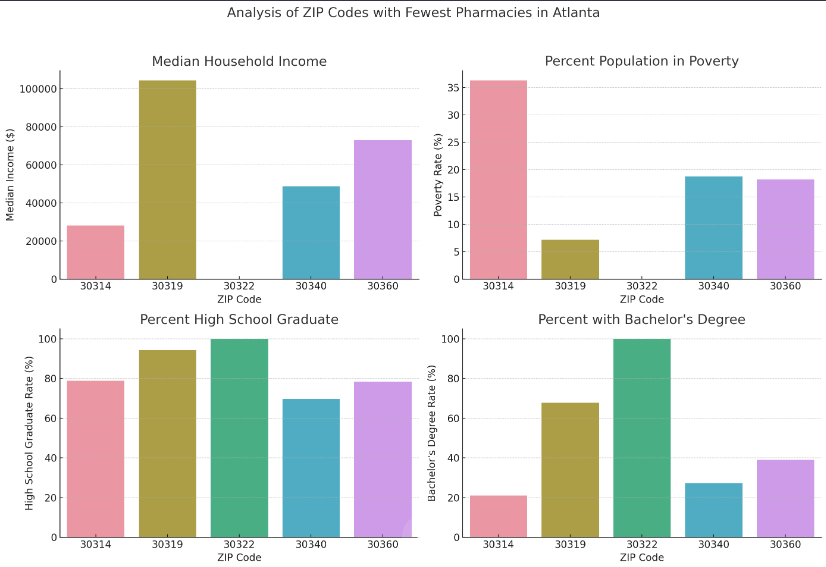
The visualizations provide a clear representation of various demographic factors for the ZIP codes in Atlanta with the fewest pharmacies:
- Median Household Income Chart: This chart shows significant variations in median household income across the ZIP codes. ZIP Code 30319 stands out with a notably higher median income, while 30314 has the lowest.
- Percent Population in Poverty Chart: Here, we see a stark contrast in the poverty rates among these ZIP codes. ZIP Code 30314 has a significantly higher poverty rate, while 30319 has the lowest.
- Percent High School Graduate Chart: This visualization indicates the percentage of the population that has graduated from high school in each ZIP code. The rates are relatively high across all ZIP codes, with 30322 and 30360 showing the highest percentages.
- Percent with Bachelor's Degree Chart: This chart displays the proportion of the population holding a bachelor's degree. ZIP Code 30319 has the highest bachelor's degree holders rate, followed by 30360 and 30322. ZIP Code 30314 has the lowest rate.
These charts highlight the disparities in economic and educational backgrounds across different ZIP codes, correlating these with pharmacy accessibility. This information is valuable for understanding the factors influencing pharmacy distribution and for guiding targeted policy interventions.
Mapping the Impact
To comprehend the magnitude of this issue, we have developed a series of maps that illustrate the correlation between pharmacy access and various demographic factors in Atlanta, GA. These maps will highlight:
Atlanta Pharmacies by Median Income
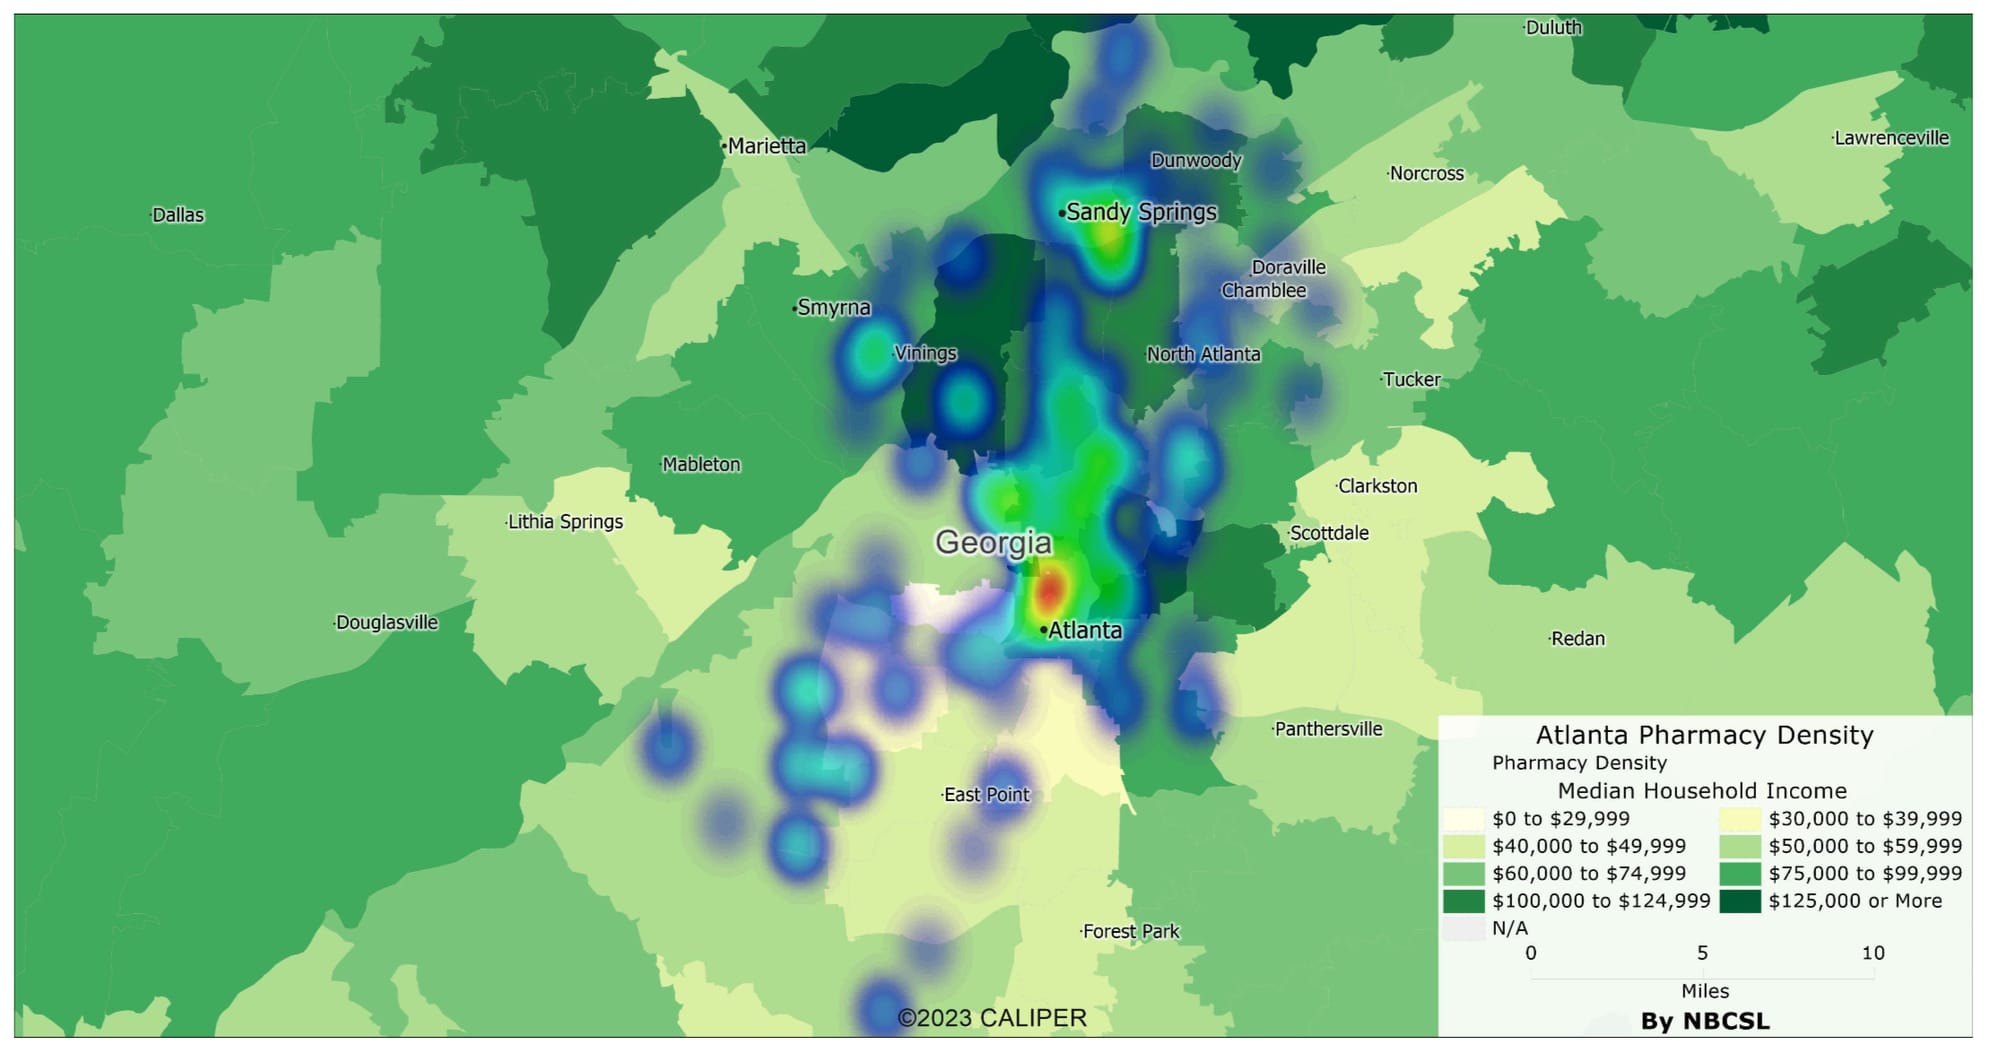
Drug Store Density by Median Income: Areas with lower median incomes tend to have fewer drug stores, indicating a direct relationship between economic status and access to pharmacy services.
Atlanta Pharmacies by Education
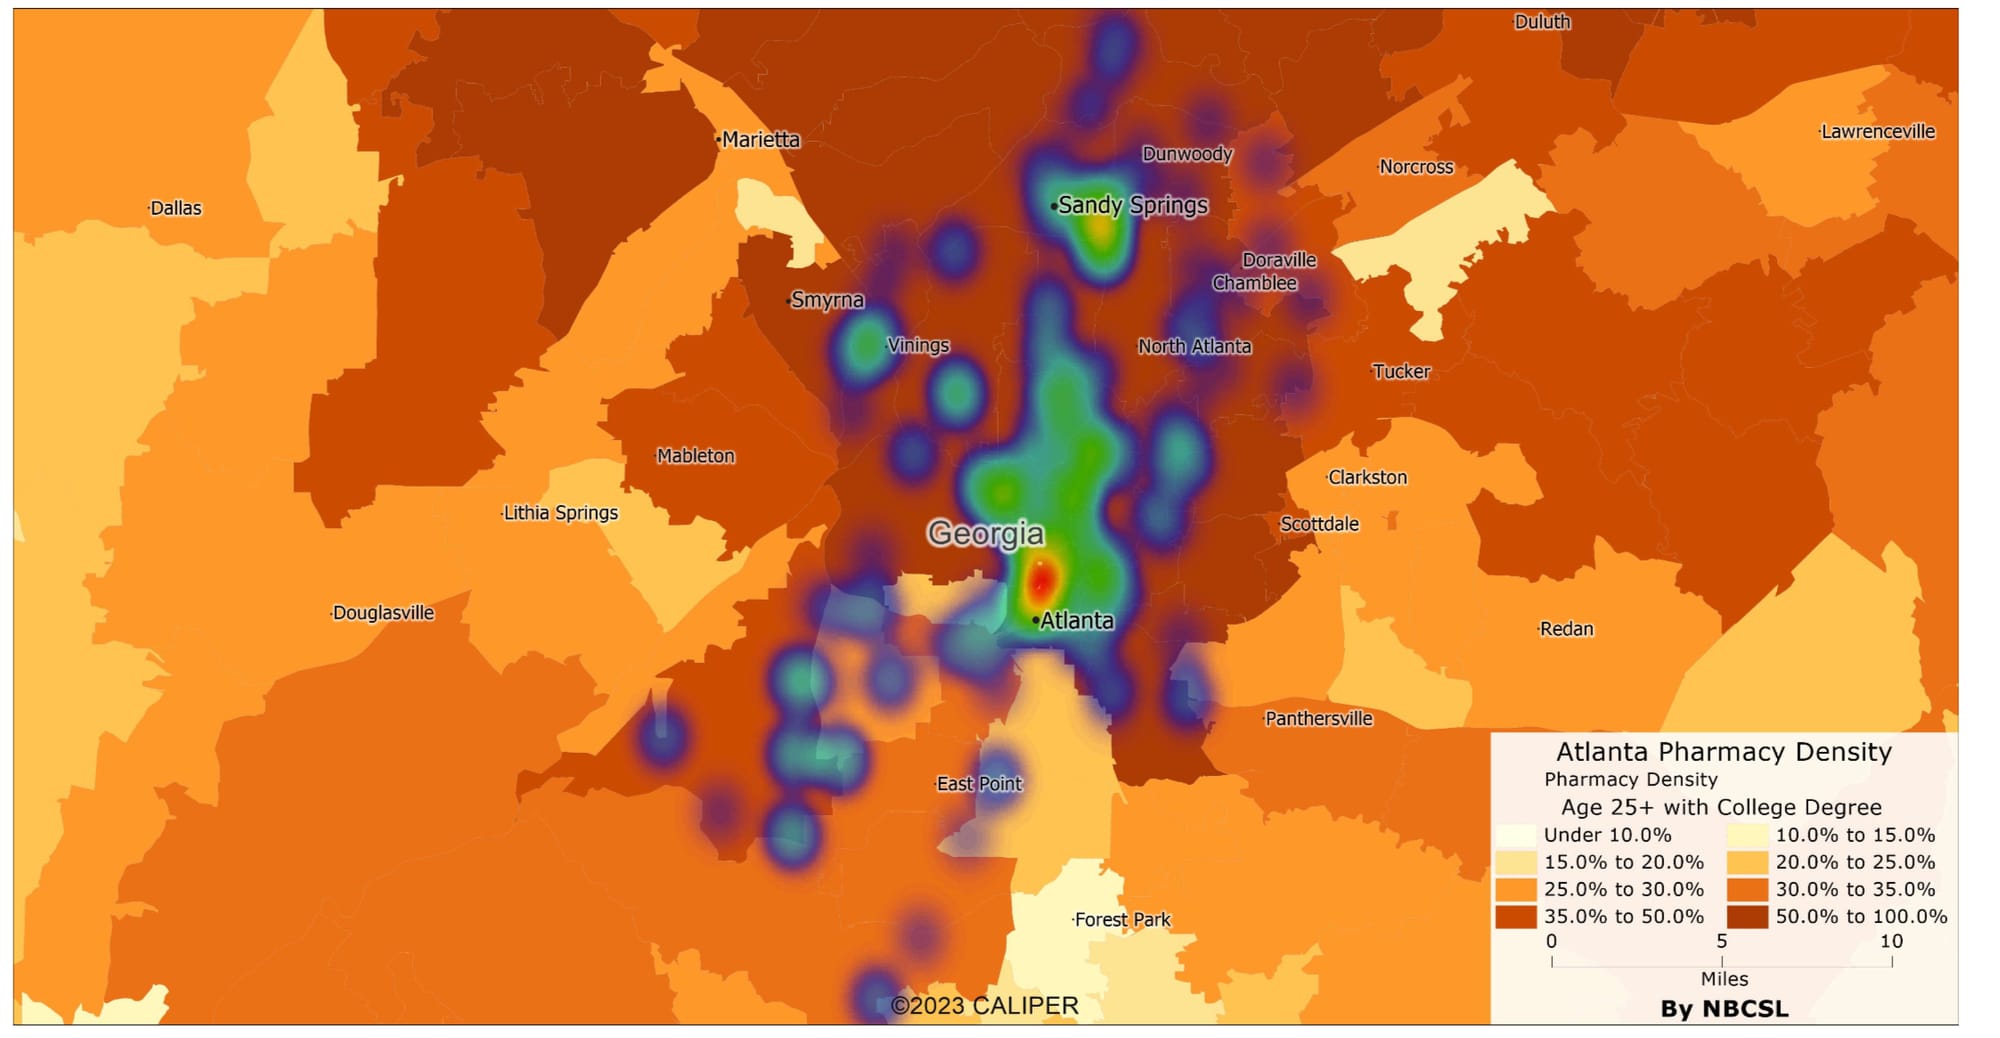
Impact on Education Levels: Communities with lower education levels often have reduced access to pharmacies, reflecting a disparity in healthcare accessibility correlated with educational attainment.
Atlanta Pharmacies by Elderly Population
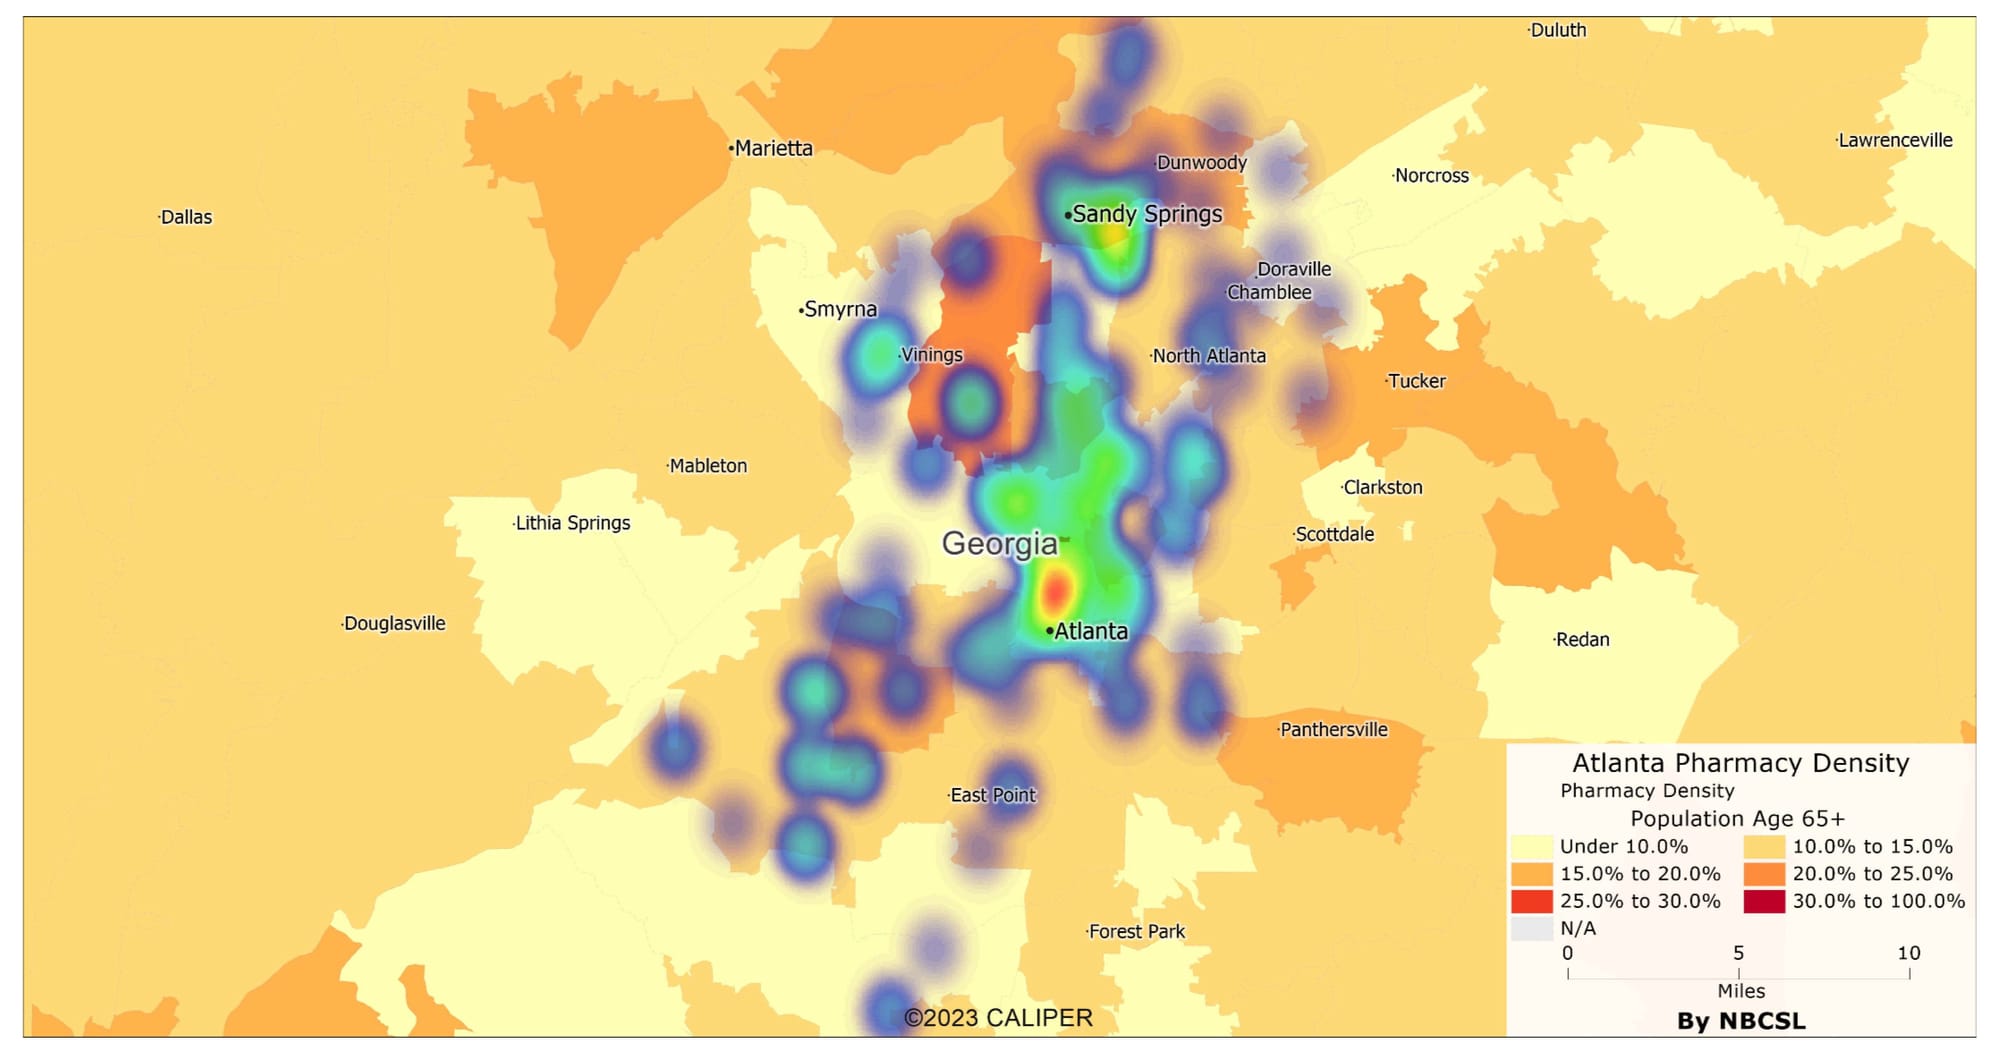
Elderly Population (Age 65+): Older communities are particularly vulnerable, as they often require more frequent access to pharmacy services.
Atlanta Pharmacies by Uninsured Rates
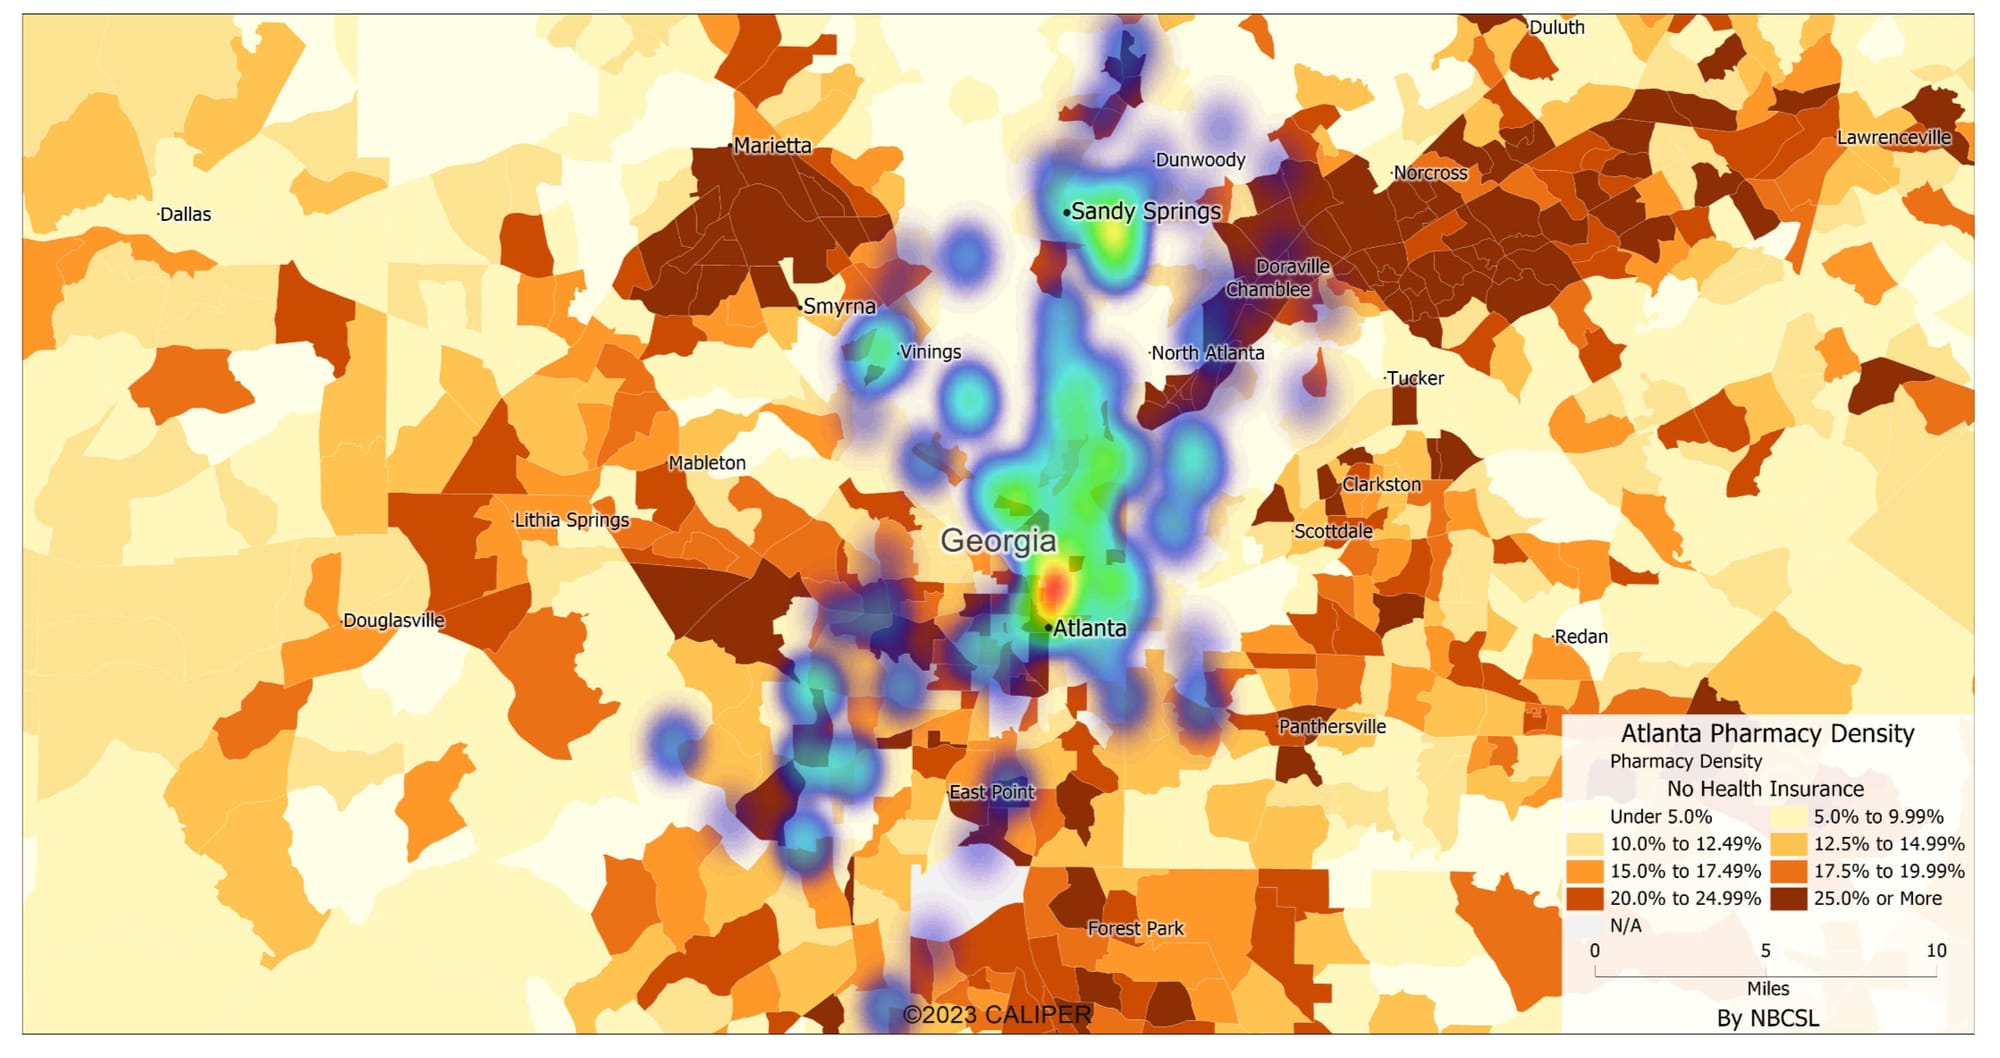
Uninsured Rates: Higher uninsured rates in certain zip codes align with reduced pharmacy access, underscoring the challenges faced by uninsured individuals in obtaining essential medications.
Atlanta Pharmacies by Poverty Status
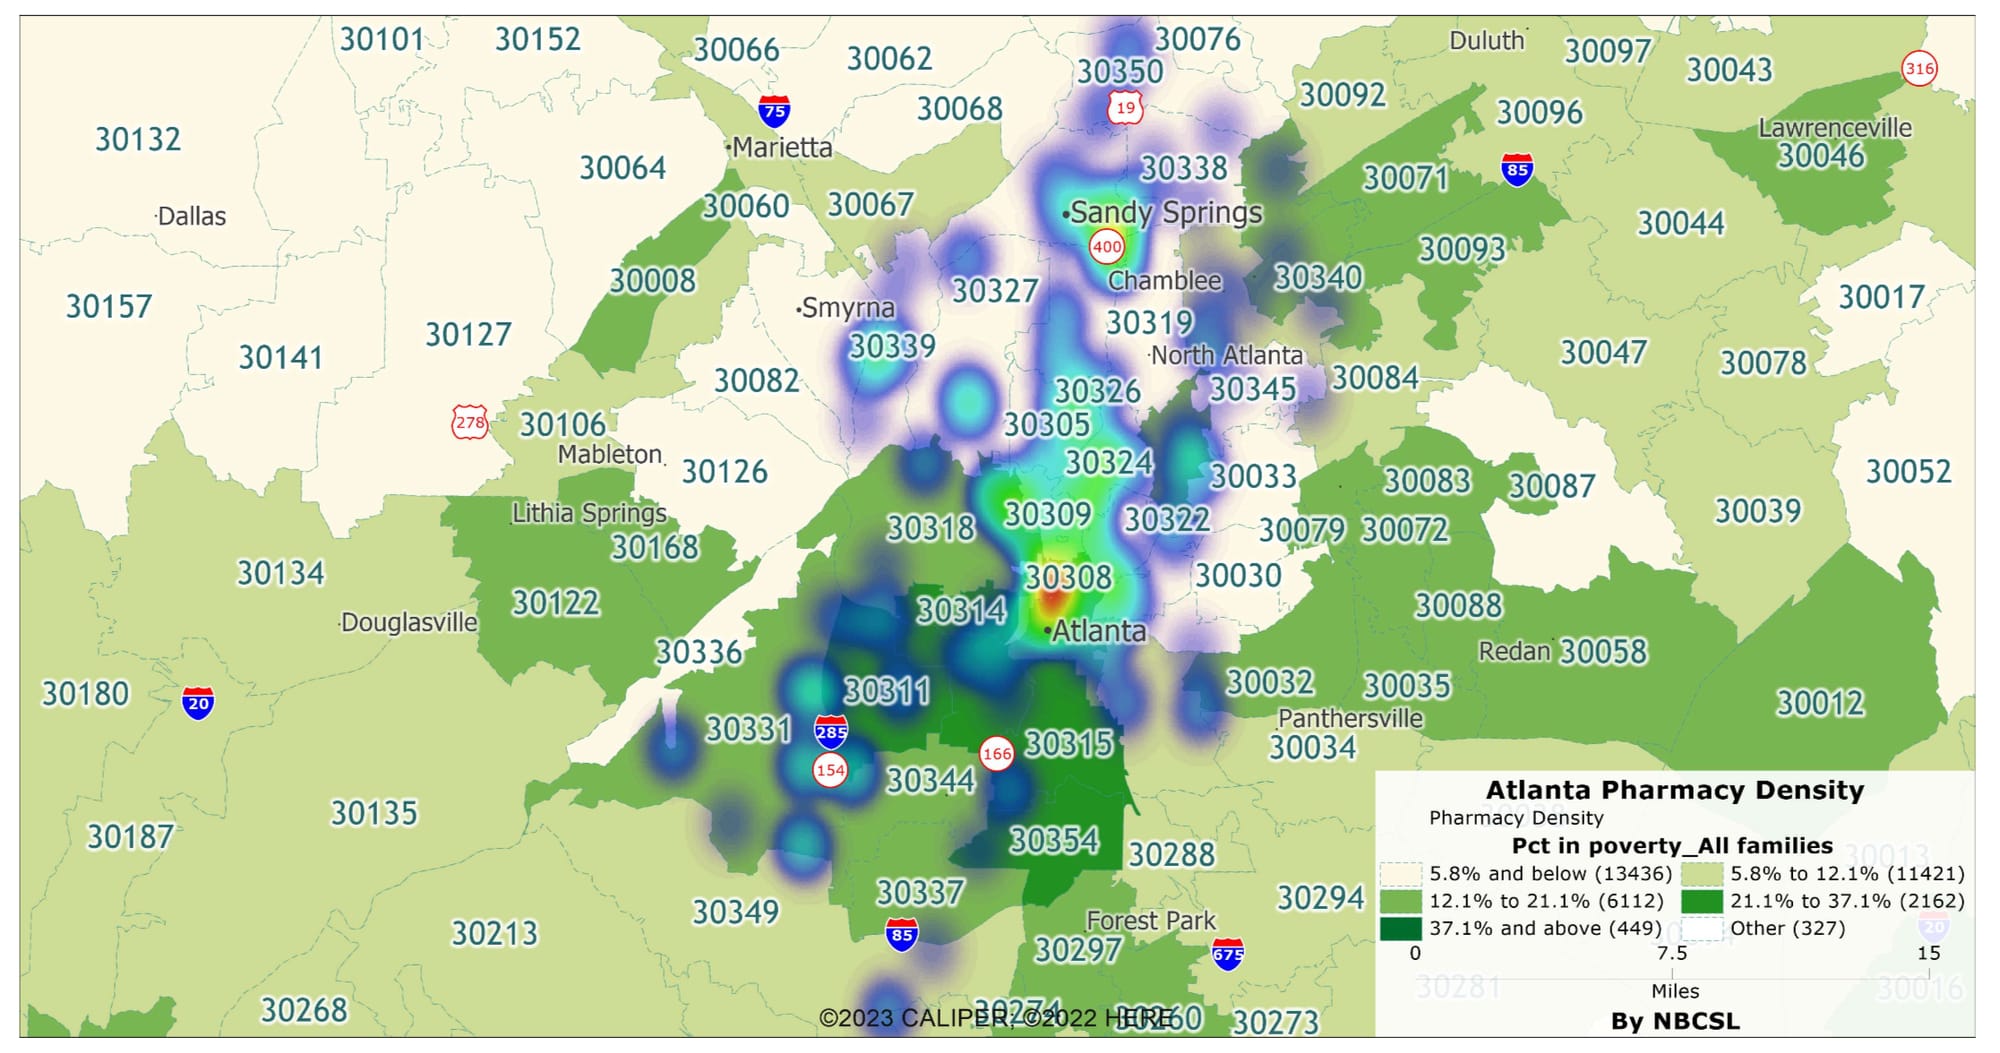
Poverty Status: A stark contrast in pharmacy access is evident in areas with higher poverty rates.
Atlanta Pharmacies by TANF Funding
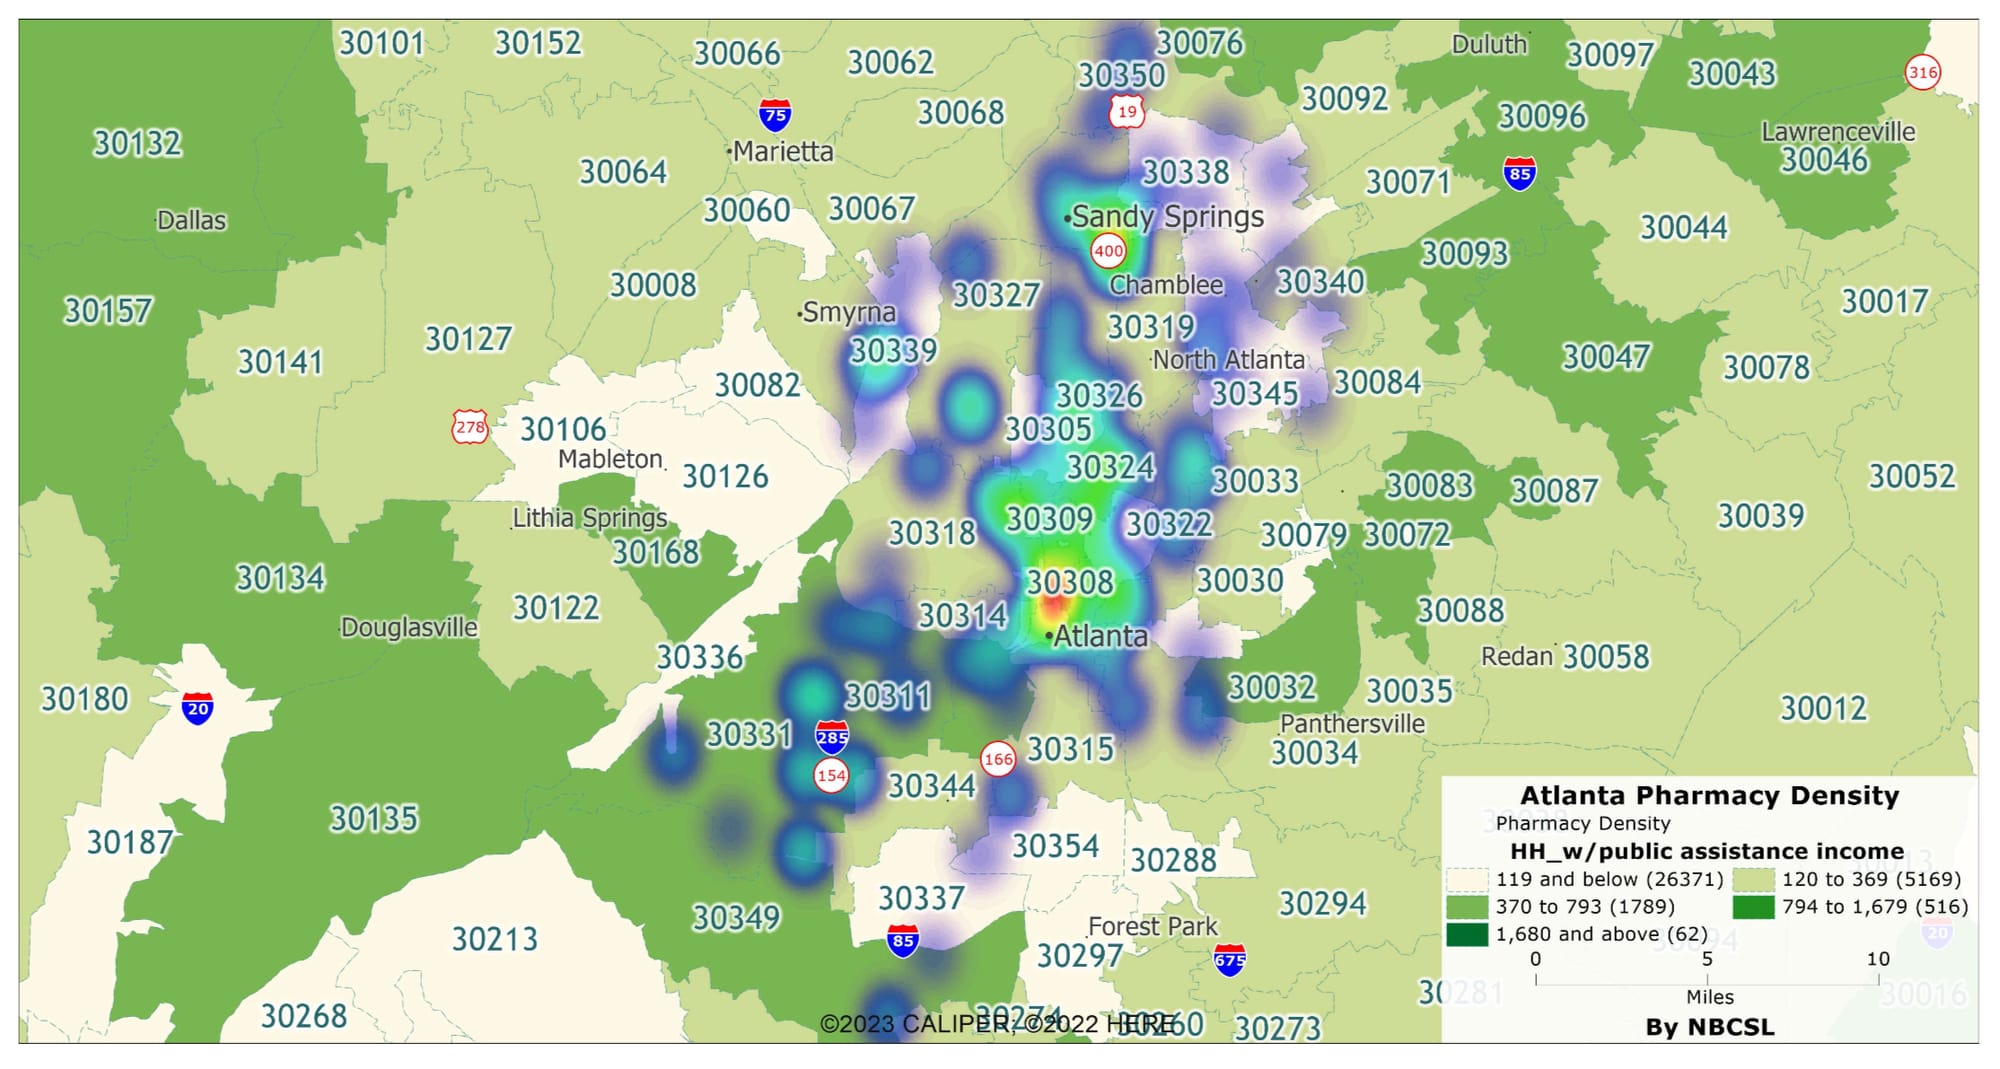
TANF Funding: Areas with higher reliance on Temporary Assistance for Needy Families (TANF) also suffer from limited pharmacy access.
Atlanta Pharmacies by Single-Parent Households
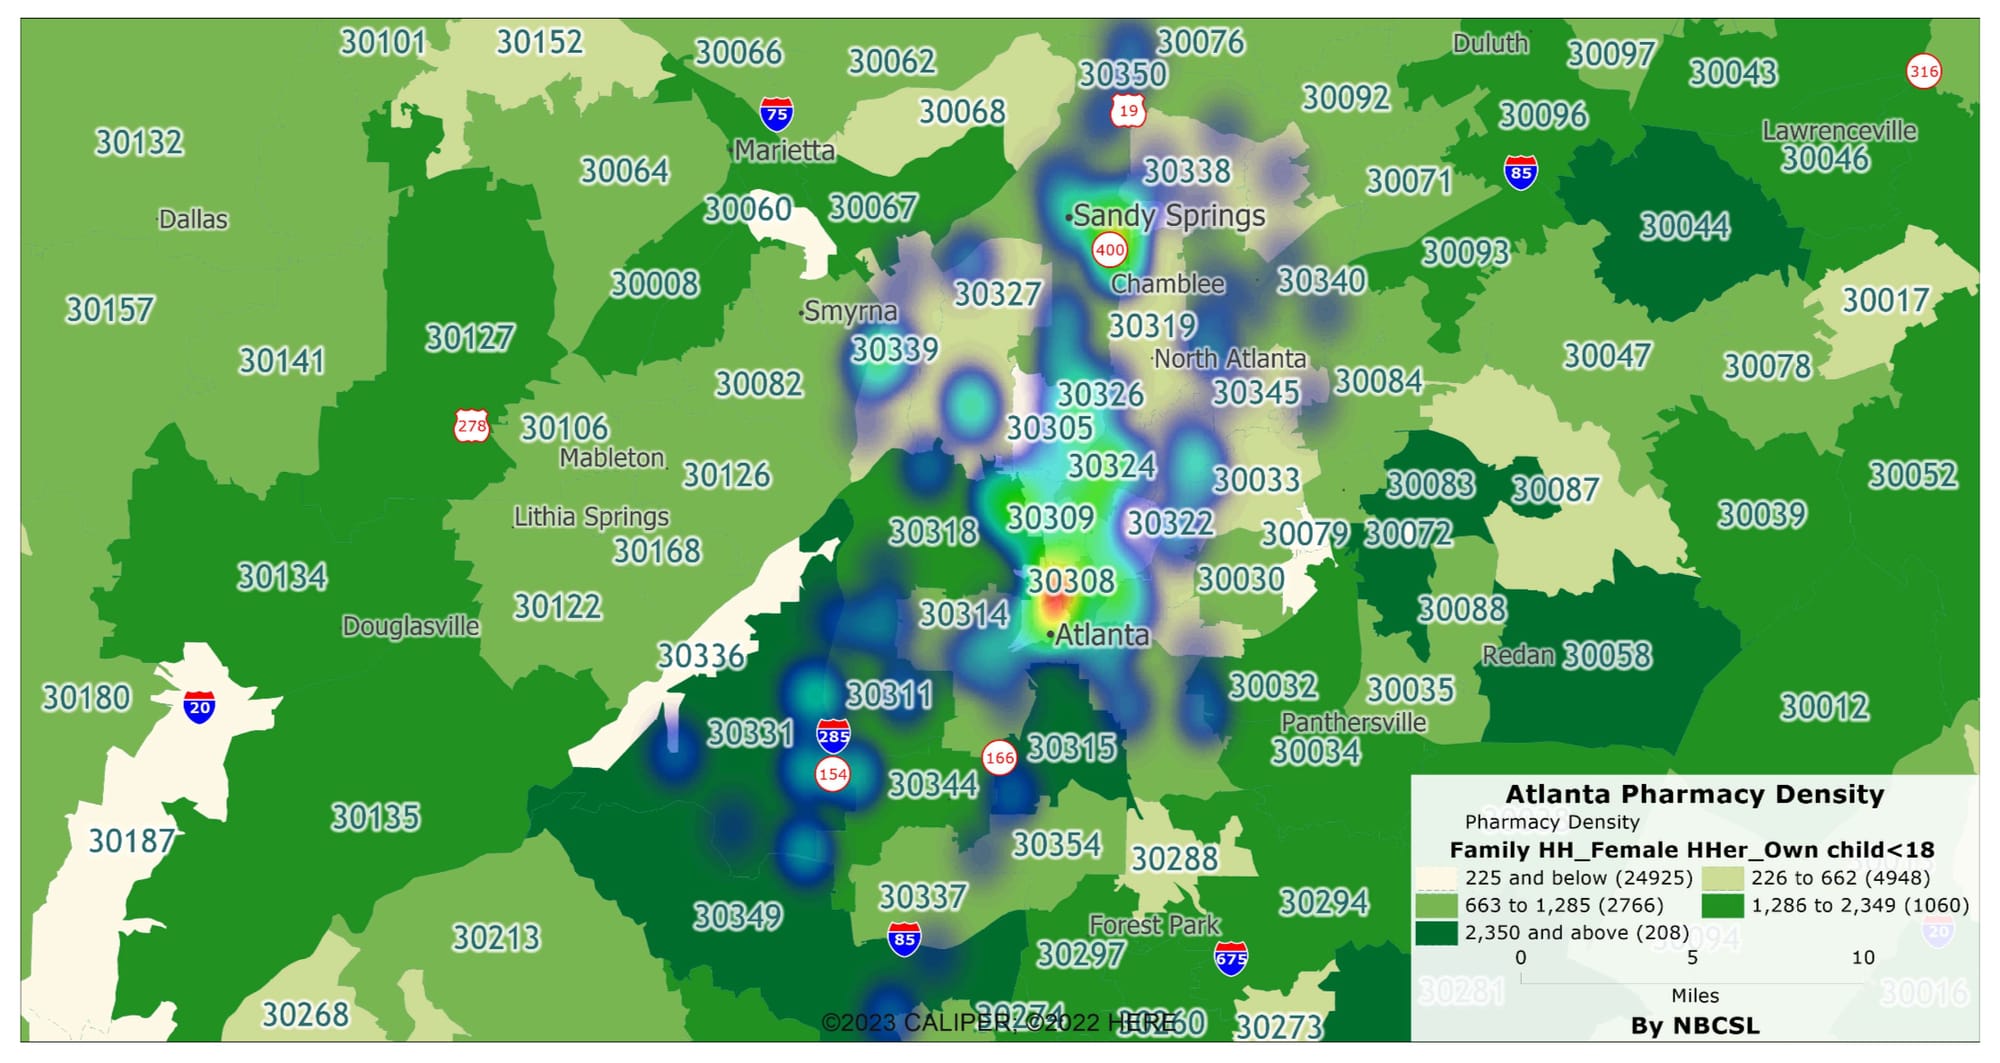
Single-Parent Households: Single-parent households, often juggling multiple responsibilities, face additional challenges due to reduced pharmacy availability.
Atlanta Pharmacies by Single-Parent Households
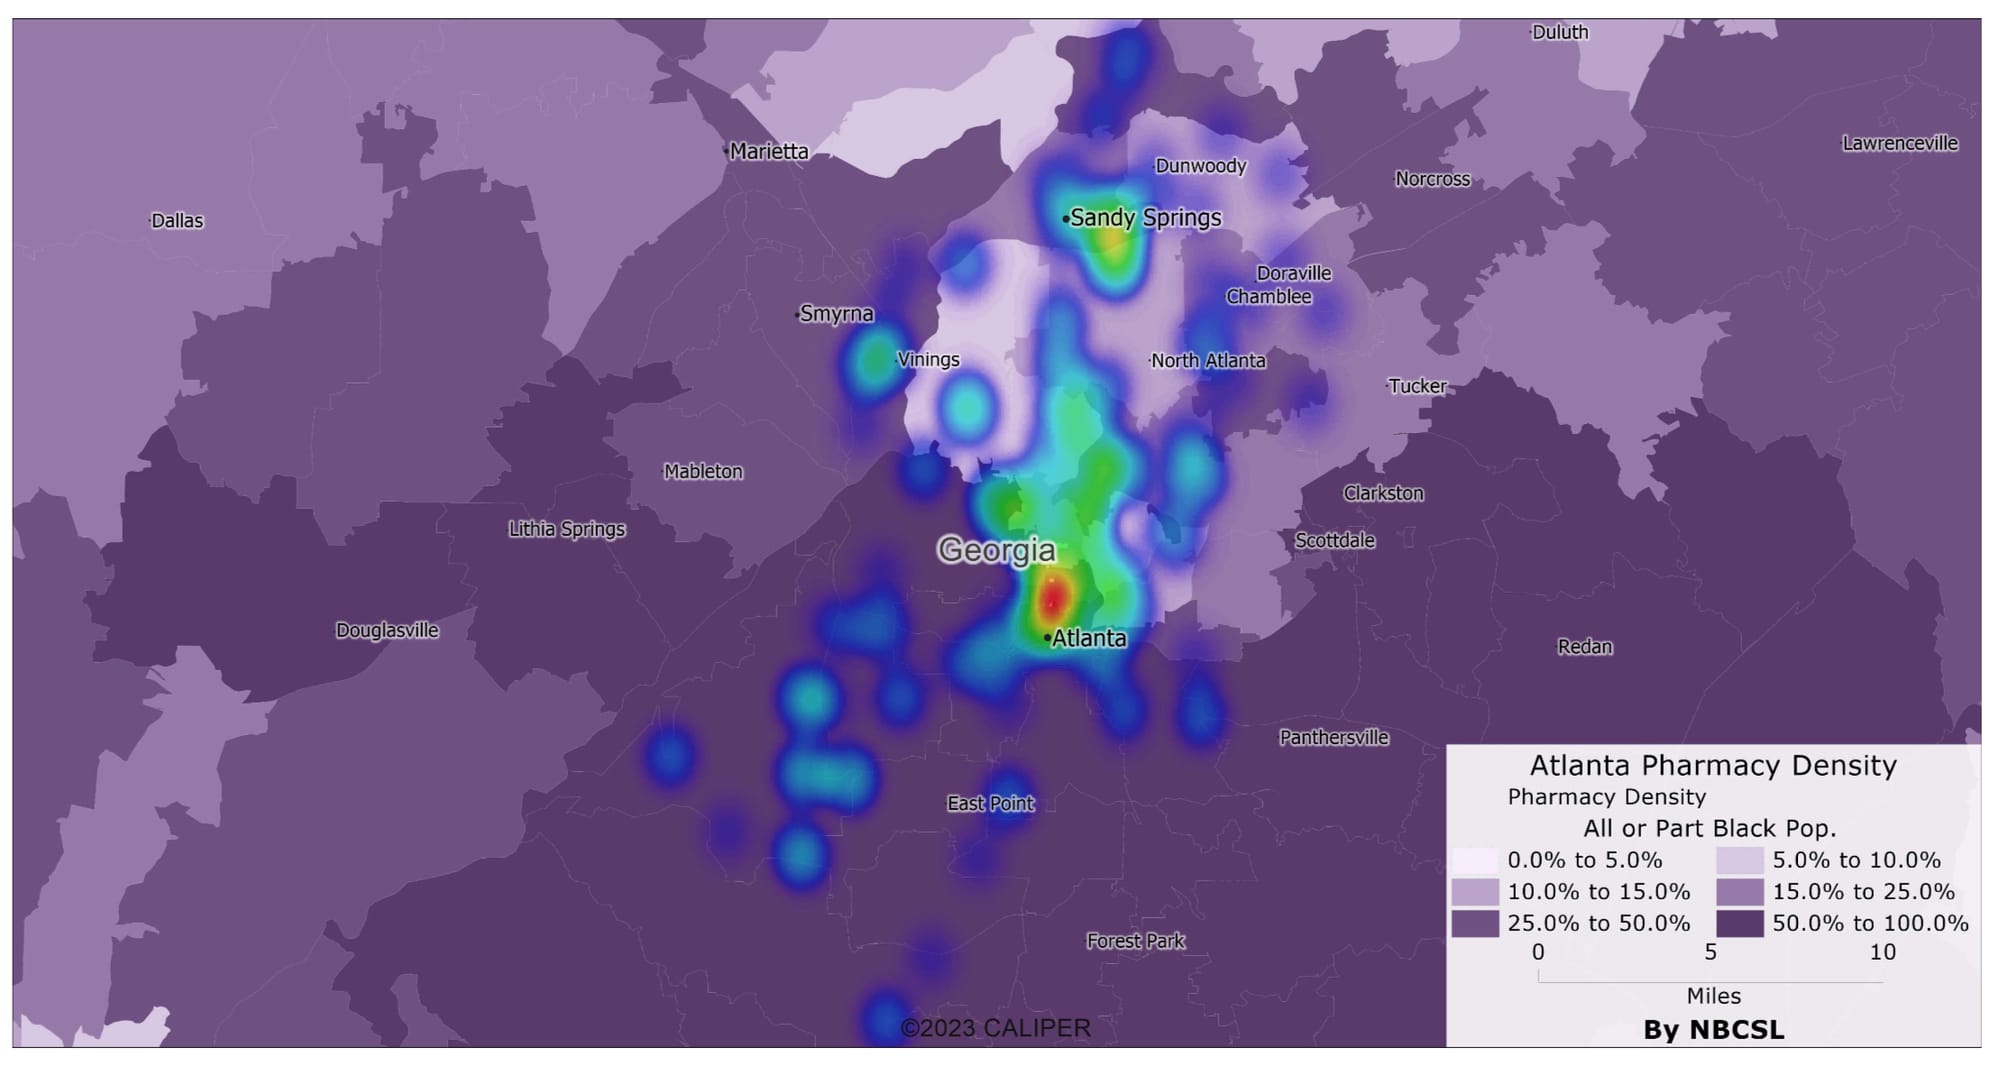
African-American Households: This map specifically highlights areas with a higher concentration of African-American households, revealing a notable disparity in pharmacy accessibility.
African-American Pharmacies Scatter Plot
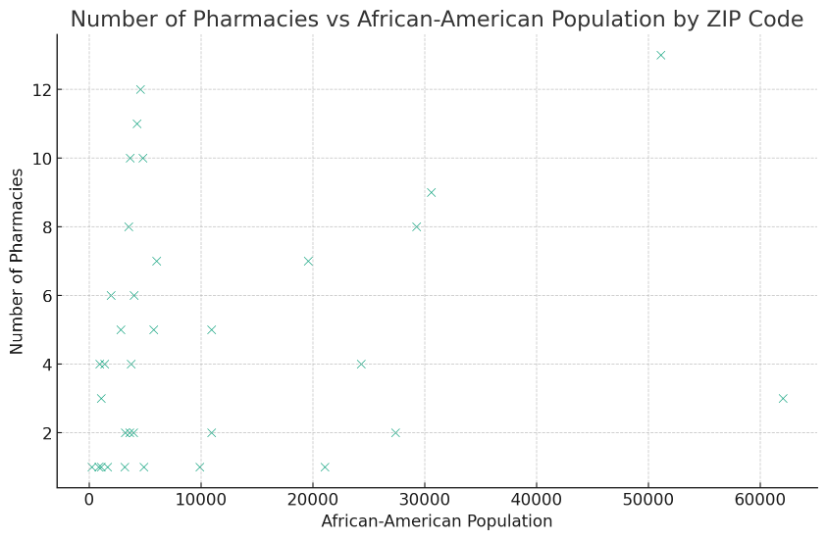
The scatter plot and correlation coefficient provide insights into the relationship between the number of pharmacies and the African-American population across different ZIP codes in Atlanta:
- Scatter Plot: The plot visualizes each ZIP code based on the size of its African-American population and the number of pharmacies. While there is some degree of scatter, a pattern or trend may not be immediately clear.
- Correlation Coefficient: The correlation coefficient between the number of pharmacies and the African-American population is approximately 0.23. This indicates a weak positive correlation, suggesting that areas with larger African-American populations tend to have slightly more pharmacies, but the relationship is not strongly pronounced.
Given the weak correlation, it's important to consider other factors that might influence pharmacy distribution, such as income levels, poverty rates, or overall population size. Additionally, the analysis might benefit from a more detailed statistical approach, such as regression analysis, to control for other variables and better understand the impact of the African-American population on pharmacy availability.
Conclusion
The closure of drug stores, while rooted in economic decisions, has far-reaching consequences that disproportionately affect Black communities across the United States. This issue clearly indicates the systemic challenges that need to be addressed to ensure equitable access to healthcare services. As we continue to navigate these changes, it's imperative to understand and address the underlying causes, including the role of PBMs, to mitigate the adverse impacts on vulnerable populations.