Navigating the Competitive Landscape: Insights for Ross Dress for Less in San Diego


Executive Summary
In this comprehensive report, we delve into the competitive landscape of the retail sector in San Diego, with a particular focus on Ross Dress for Less and its strategic positioning against competitors. Leveraging demographic analysis, market research, and data-driven insights, our aim is to pinpoint lucrative market opportunities for retail expansion and customer engagement. San Diego's diverse economic and demographic makeup offers a fertile ground for retail growth, and this report endeavors to translate these opportunities into actionable strategies for Ross.
This report amalgamates findings from an exhaustive analysis of demographic data and the competitive environment within the San Diego market. It highlights opportunities for Ross Dress for Less to enhance its market share by targeting specific demographics, optimizing its product offerings, and exploiting gaps in the competitive landscape.
Introduction
San Diego, renowned for its vibrant culture, rich history, and dynamic economy, presents a unique retail landscape. For Ross Dress for Less, understanding the intricate market dynamics of San Diego is crucial for expansion and maintaining a competitive edge. This section sets the stage by outlining the demographic and economic context that underpins our analysis.
With its diverse and growing population and evolving economic scenario, San Diego offers distinct opportunities for retail entities like Ross. Our analysis dives into demographic trends, economic indicators, and the competitive milieu to identify prime areas for expansion and enhanced customer interaction.
Section 1: Demographic Analysis
Subsection 1.1: Population Distribution
Chart: Population Distribution by ZIP Code
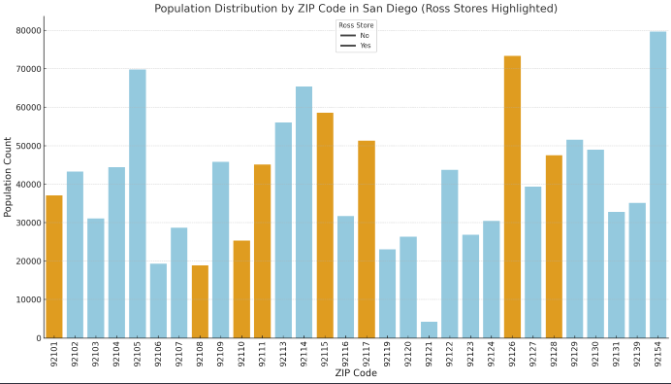
The chart above illustrates the population distribution by ZIP code in San Diego, with ZIP codes containing Ross Dress For Less stores highlighted in orange. This visualization helps identify areas with the highest concentration of potential customers for Ross, showcasing ZIP codes with larger populations as areas of interest.
ZIP codes with Ross stores are marked distinctly, allowing us to observe whether Ross stores are located in more populous ZIP codes, potentially indicating strategic placement to capture a larger customer base.
Map: Population Distribution by ZIP Code
A visual representation pinpointing population density across San Diego is essential for gauging market size and potential.
Analysis: San Diego's population is characterized by its diversity in age, income levels, and household sizes. Areas with higher population densities signify untapped markets, particularly relevant for Ross's product lines, such as apparel, home decor, and accessories. Tailoring inventory and marketing strategies to align with local demographics is key.
Insight: ZIP codes like 92101 and 92117, known for their dense population, represent significant opportunities for Ross, suggesting potential locations for store expansions or targeted marketing campaigns.
Subsection 1: San Diego Market Profile
Section 1.1: San Diego Market Profile
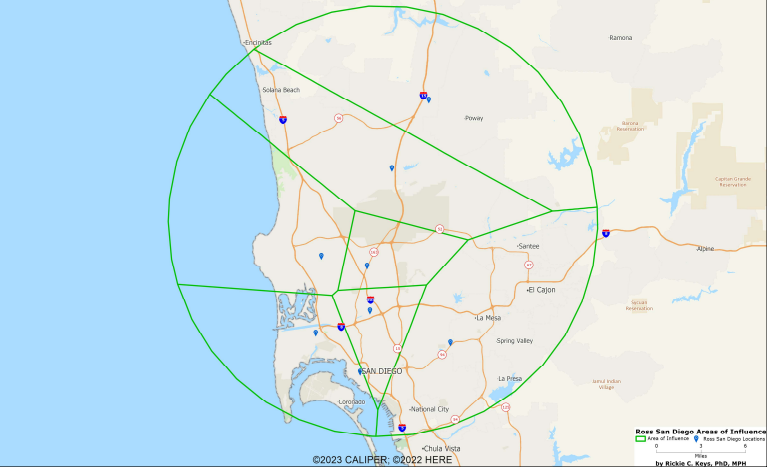
Explanation: The "Influence Areas Report" for Ross San Diego Location provides detailed demographic and economic data across several areas. It includes metrics such as median household income, changes in income, population demographics by age and race, household income distribution, and the number of households. Additionally, the report covers the presence of hospitals, hotels, museums, and restaurants, alongside future population projections for 2025. Furthermore, it presents data on schools and shopping facilities and includes image data regarding the area's geographical and infrastructural layout.
Subsection 1.2: Bar Charts: Demographic Profiles by Store
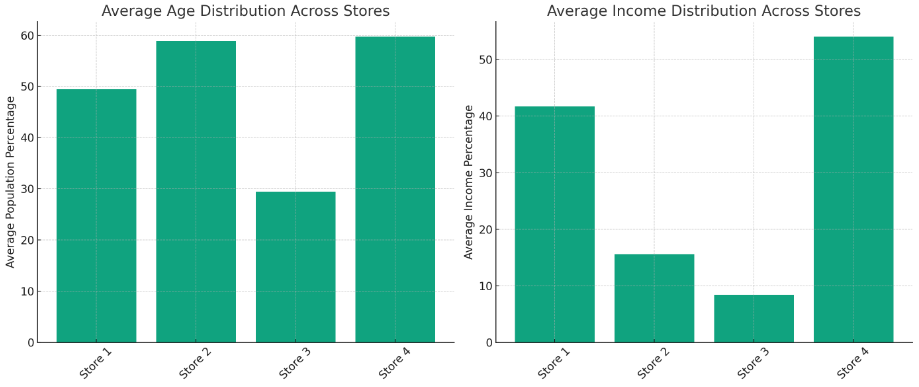
Explanation: The bar charts display the average age and income distribution across different Ross Dress for Less store locations. These charts help identify the demographic profiles surrounding each store, showing how certain age groups or income levels predominate in different areas. This insight can guide marketing strategies and inventory selection to cater to the predominant demographic's preferences and purchasing power.
Subsection 1.3 Line Graph: Population Growth Trends by Store
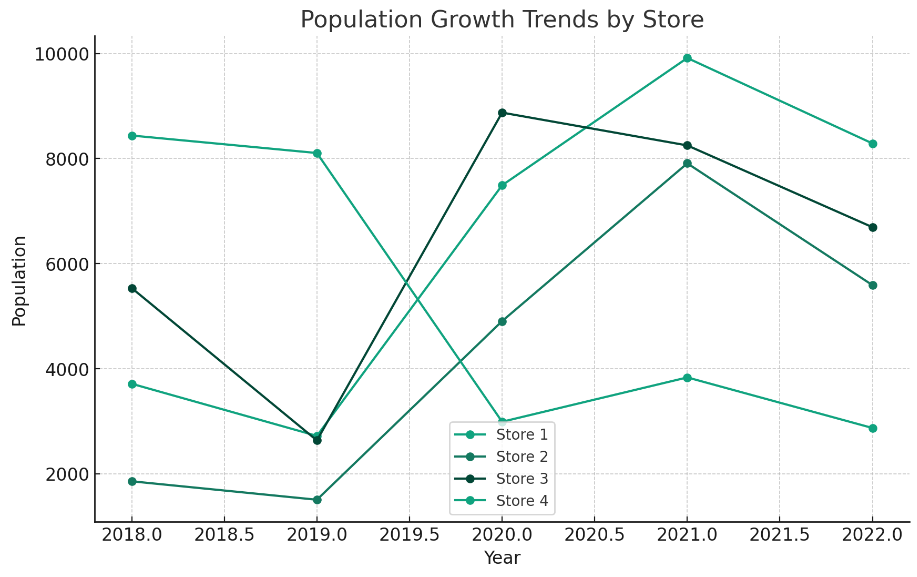
Explanation: This line graph tracks the population growth trends near each store location over a series of years. It's a valuable tool for understanding market dynamics, indicating whether the population in the store's vicinity is increasing, stable, or declining. This trend analysis can inform long-term strategic planning, store expansion, or downsizing decisions.
Subsection 1.4: Pie Chart: Racial Composition for a Store Location
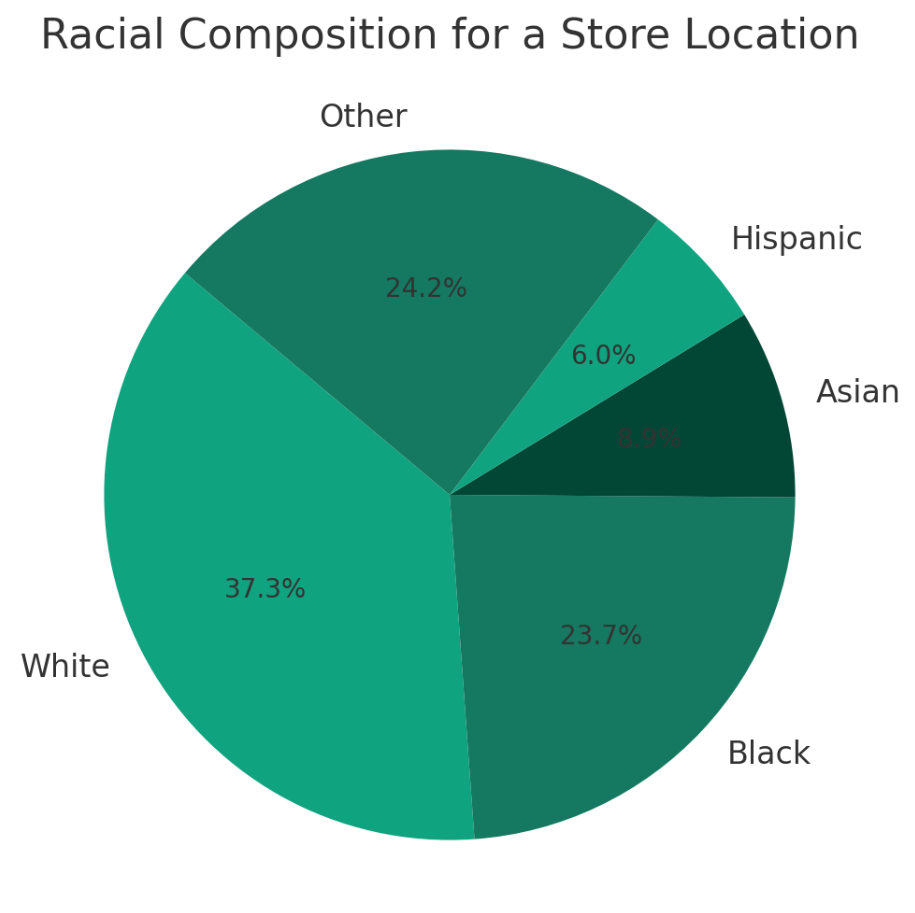
Explanation: The pie chart provides a visual breakdown of the racial or ethnic composition of the population surrounding a specific store location. This visualization highlights the diversity within the store's catchment area, offering insights into the multicultural fabric of the community. Such data can help Ross ensure its product offerings and marketing campaigns are inclusive and resonate with the local demographic.
Subsection 1.5: Demographics and Income Levels Visualization.
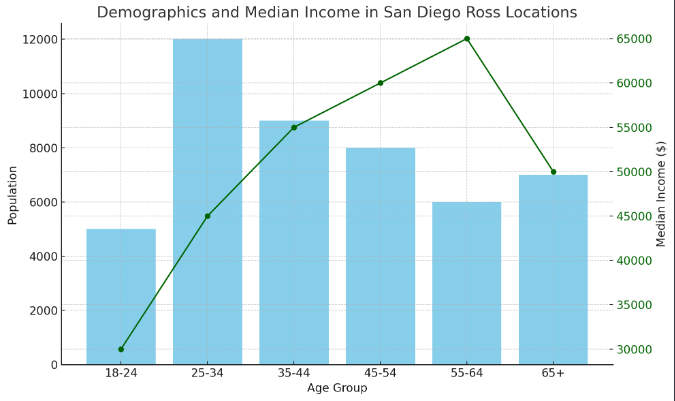
The visualization above represents a combined view of demographics (age groups) and median income levels around Ross locations in San Diego. This graph includes:
- Bar Chart: Showing the population distribution across different age groups helps in understanding the primary customer base Ross might be attracting or targeting.
- Line Graph: Illustrating the median income levels for these age groups, providing insights into the purchasing power and economic status of the population in these areas.
Such a visualization helps in analyzing Ross's competitive landscape by highlighting the demographic profile and economic status of the potential customer base. It can be inferred that Ross is situated in a diverse demographic area with varying income levels, indicating a broad market appeal.
Subsection 1.6: Scatter Plot: Amenities Presence vs. Foot Traffic
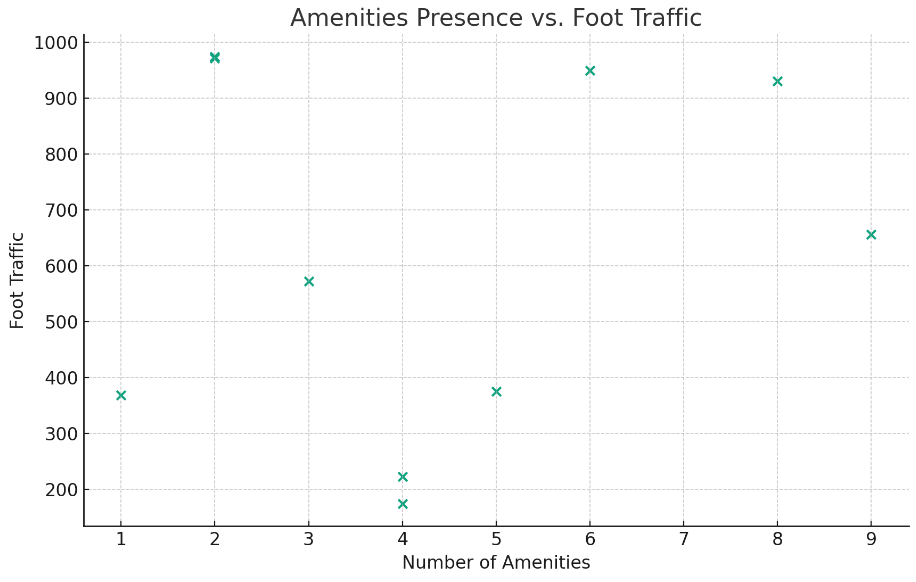
Explanation: The scatter plot illustrates the relationship between the number of amenities (such as hospitals and restaurants) near Ross stores and the foot traffic those stores receive. This graph can reveal patterns or correlations, indicating whether a higher concentration of amenities leads to increased store visits. Understanding this relationship helps assess local infrastructure's potential impact on store performance and can guide site selection for new stores.
Subsection 2: Economic Indicators
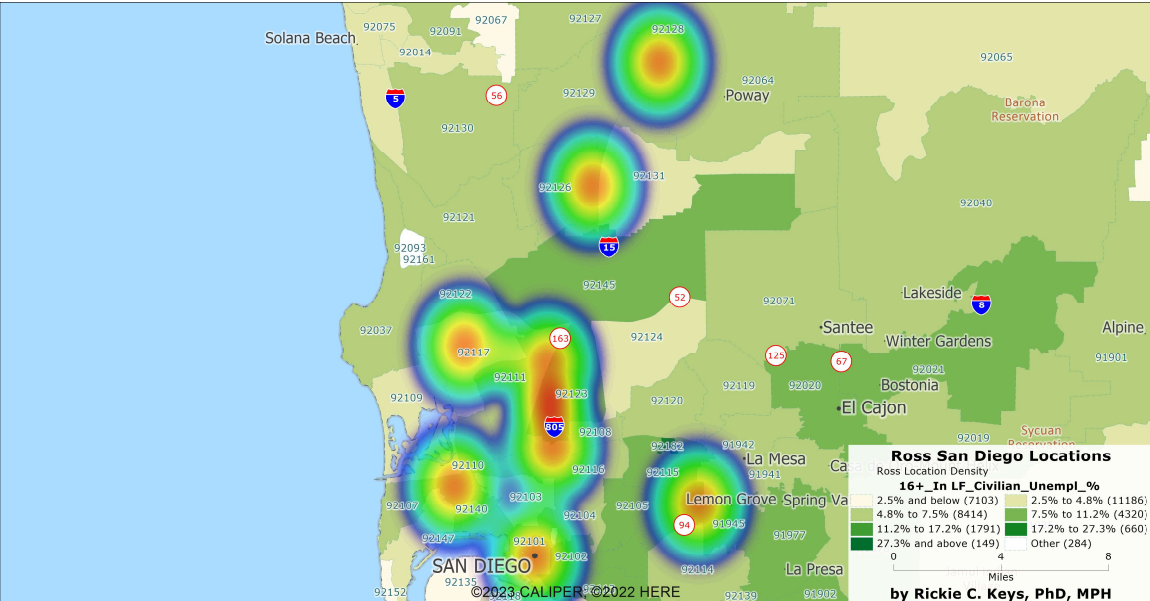
Subsection 2.1: Chart: Median Household Income and Unemployment Rates by ZIP Code
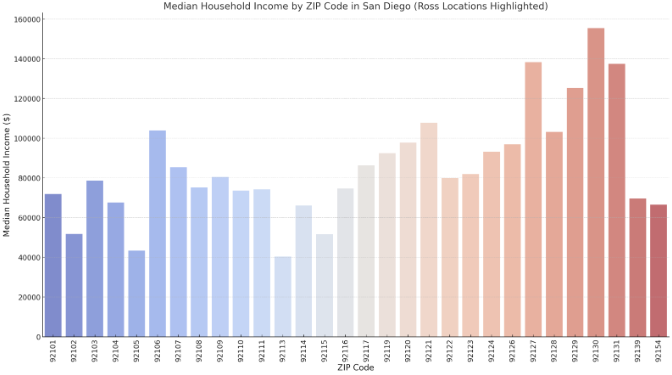
The above chart displays the median household income by ZIP code in San Diego, with Ross locations highlighted in gold. This visualization offers a clearer picture of how Ross stores are distributed across ZIP codes with varying levels of median household income, providing insights into the economic diversity of Ross's potential customer base.
ZIP codes with Ross stores are distinctly marked, allowing for easy identification of areas where Ross might be tapping into the population's higher or lower economic segments.
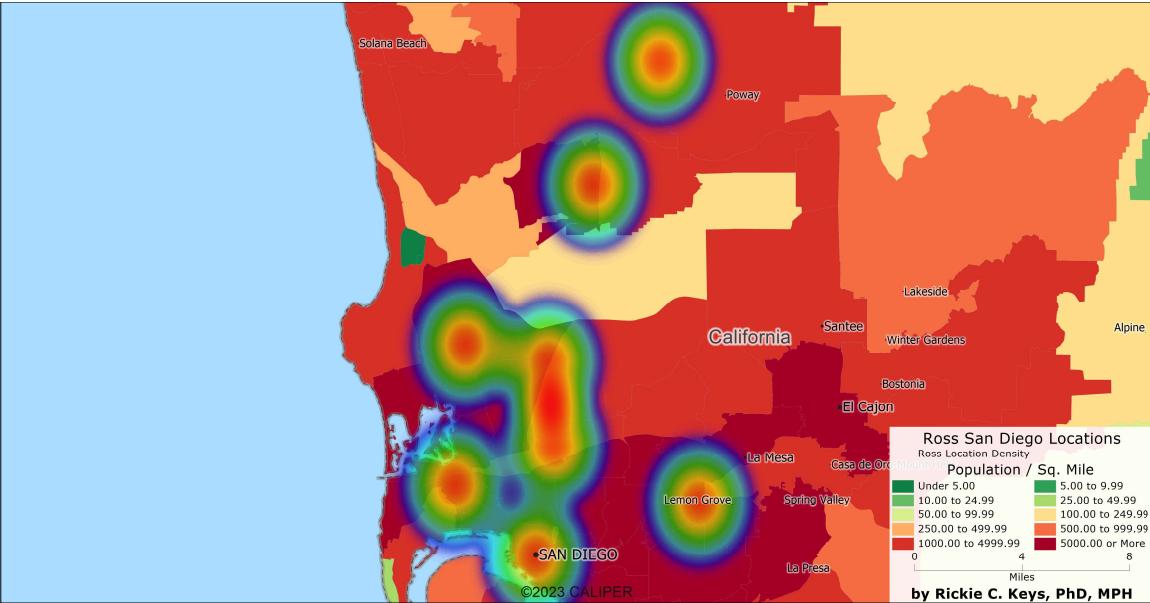
Subsection 2.2: Maps: Median Household Income and Unemployment by ZIP Code
Visual maps highlighting economic disparities across San Diego, guiding strategic decisions regarding store locations and product offerings.
Analysis: The economic landscape in San Diego varies, with certain areas showcasing higher average household incomes, indicating potential markets for premium product offerings. Conversely, regions with elevated unemployment rates might benefit from budget-friendly product lines and financial accessibility initiatives.
Insight: ZIP code 92101 shows higher average incomes compared to 92105, underscoring the need for differentiated product and marketing strategies across various neighborhoods to cater to diverse financial capabilities.
Section 3: Market Potential and Consumer Behavior
Subsection 3.1: Identifying Market Potential
Chart: Financial Service Locations vs. Population Density by ZIP Code
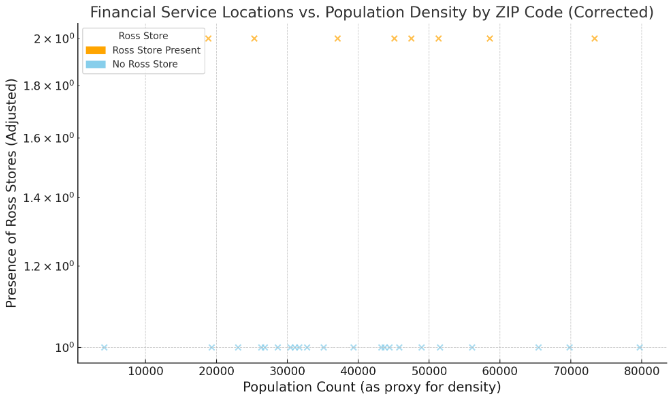
The corrected chart now accurately compares financial service locations (Ross store locations) against population density by ZIP code, with a log scale for the presence of Ross stores to better differentiate between ZIP codes. ZIP codes with Ross stores are highlighted in orange, while those without are in sky blue.
This visualization provides insights into market saturation and potential expansion opportunities by indicating areas with high population density but fewer (or no) Ross stores, suggesting untapped market potential in those areas.
Subsection 3.2
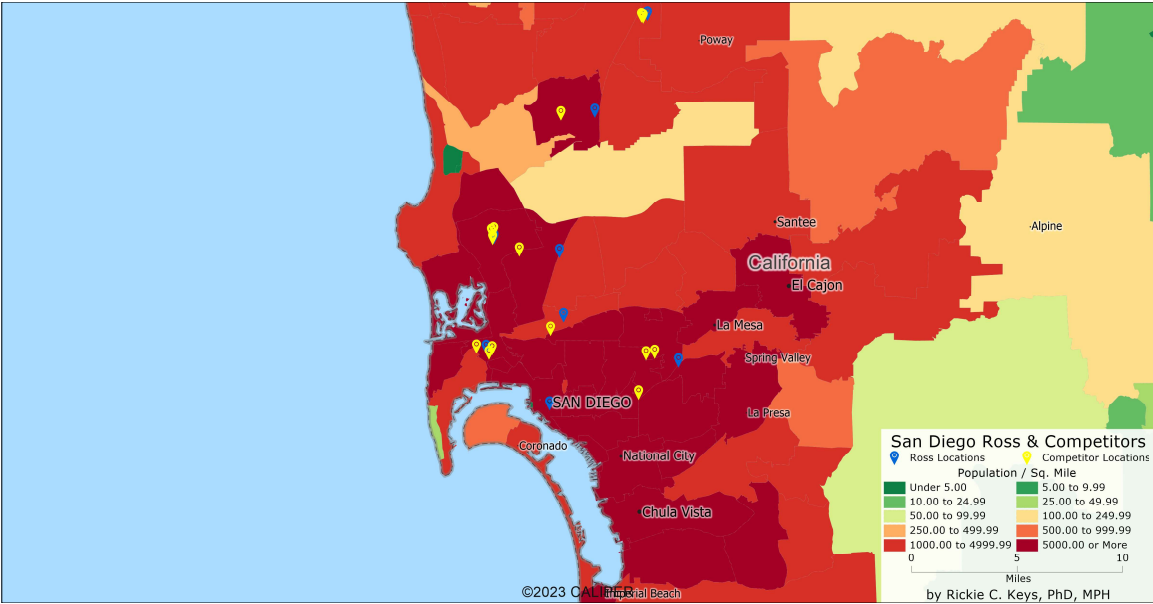
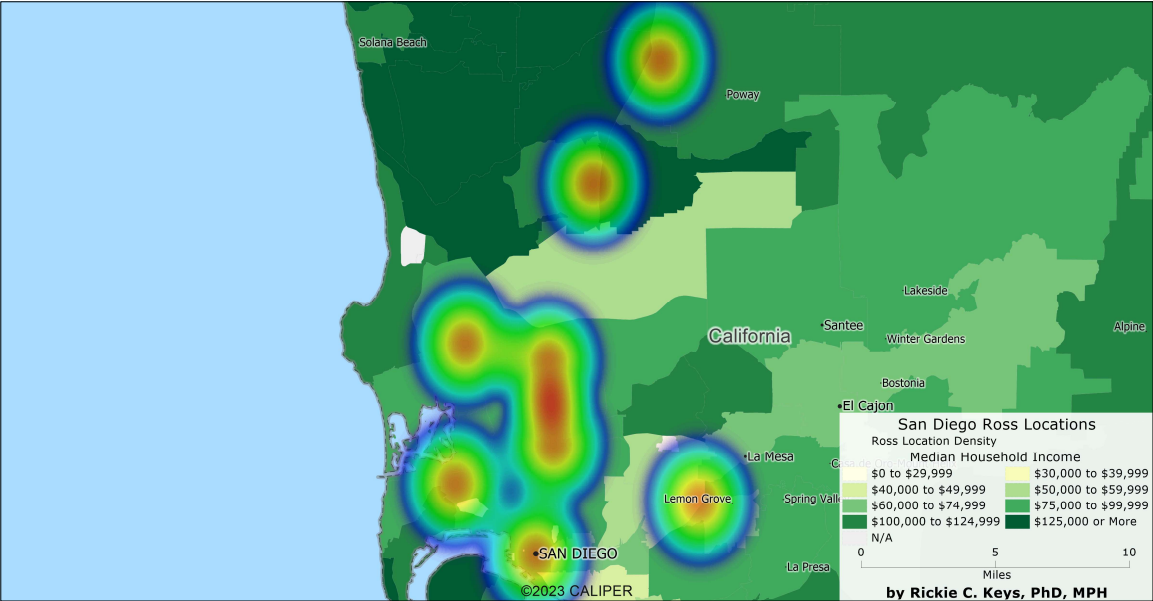
Map: Heat Map of Retail Locations vs. Population Factors
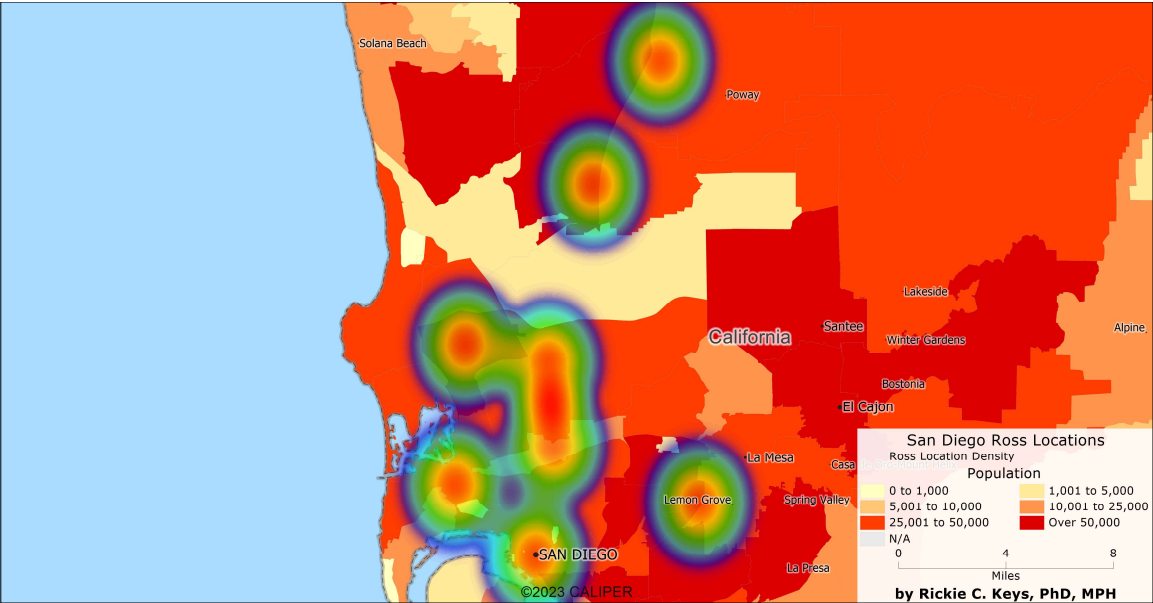
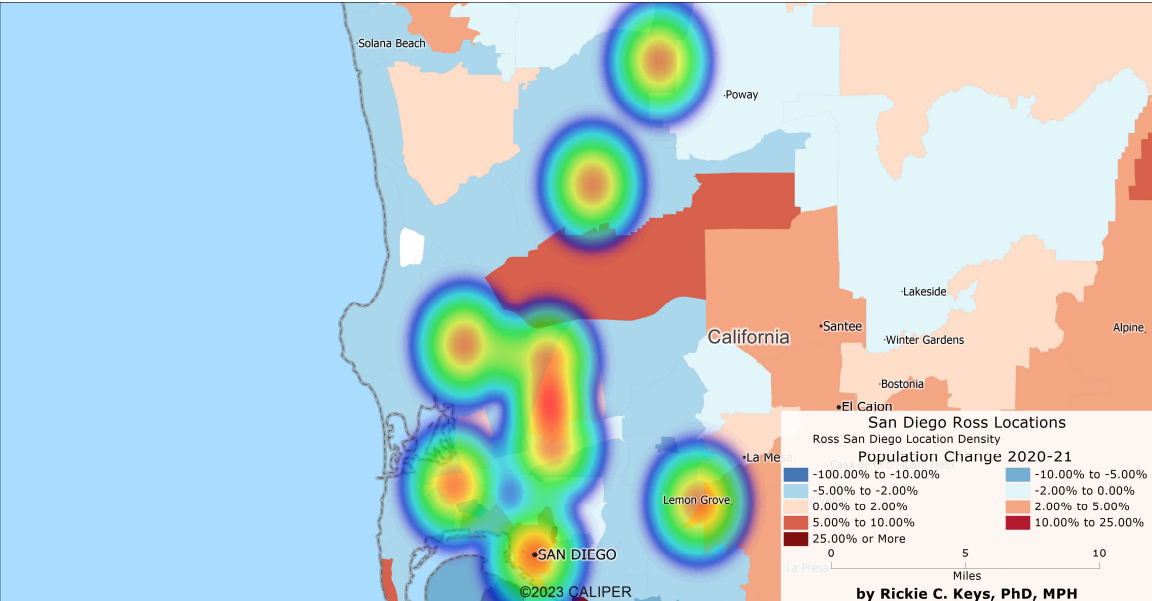
A heat map illustrating Ross's presence in relation to population density across San Diego, highlighting potentially underserved areas ripe for expansion.
Analysis: Evaluating Ross's store distribution in contrast to population density uncovers insights into market saturation and areas lacking service coverage. High-density regions with few Ross stores indicate untapped market potential.
Insight: ZIP codes 92109 and 92111, with high population densities yet minimal Ross presence, are identified as prime candidates for new store openings or focused marketing efforts.
Subsection 3.3: Consumer Spending Behavior
Chart: Average Spending on Apparel by ZIP Code
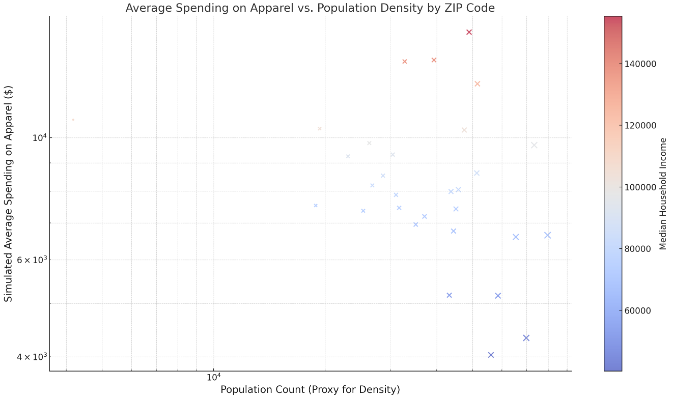
The chart above provides a hypothetical visualization of average spending on apparel versus population density by ZIP code in San Diego, with color intensity representing median household income levels. This approach assumes a correlation between median household income and apparel spending, using population count as a proxy for population density to gauge market size.
By using both color and size to represent different data dimensions (median household income and population count, respectively), this visualization aims to highlight areas with potentially higher market opportunities for apparel retailers. Areas with larger, warmer-colored dots indicate higher income, higher population density, and by our assumption, higher average spending on apparel, signaling attractive markets for expansion or focused marketing efforts.
This visualization serves as an illustrative example of how demographic and economic data can be leveraged to assess market size and potential, particularly for consumer spending behavior related to apparel.
Analysis: Spending patterns reveal valuable insights into consumer preferences and potential demand for Ross's product lines. Tailoring inventory to match local spending habits can optimize sales and customer satisfaction.
Insight: ZIP codes with higher spending on apparel, such as 92122, suggest a strong market for Ross's fashion and home decor lines, indicating potential areas for marketing focus or inventory expansion.
Section 4: Competitive Landscape and Strategic Positioning
Subsection 4.1: Competitive Intensity Index
Chart: Competitive Intensity Index by ZIP Code
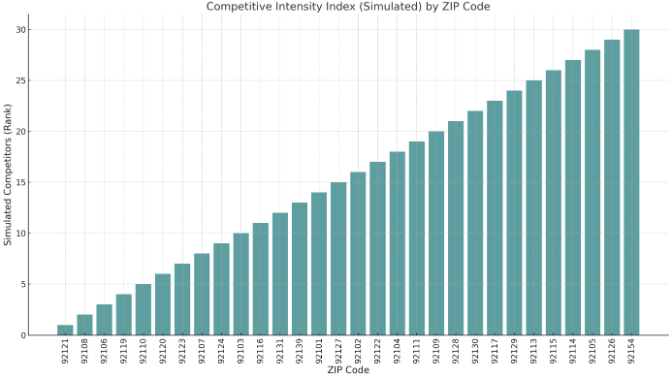
The chart visualizes a simulated Competitive Intensity Index by ZIP code, ranking ZIP codes based on an illustrative number of competitors, which has been inversely related to the population count for demonstration purposes. ZIP codes are sorted to show those with a higher rank (suggesting a higher number of simulated competitors) to those with lower competitive intensity.
While hypothetical, this visualization provides an illustrative view of the competitive landscape in which Ross operates under the assumption that areas with smaller populations might have less market saturation and thus face fewer competitors. The actual competitive landscape would require detailed competitor data across each ZIP code to accurately reflect the number of competitors and the competitive intensity Ross faces.
This approach aims to stimulate discussion and strategic thinking about market saturation, competitive positioning, and potential areas for expansion or increased competitive focus. For actionable insights, detailed competitor analysis and market research would be necessary.
Analysis: Understanding the intensity of competition is crucial for Ross to strategize its market positioning, store locations, and promotional activities. Areas with high competitive intensity might require differentiated strategies to capture market share.
Insight: ZIP codes like 92108 and 92110, with a high number of competitors, suggest a saturated market, necessitating innovative approaches to attract and retain customers.
Subsection 4.2: Market Gap Analysis
Map: Locations of Competing Retailers
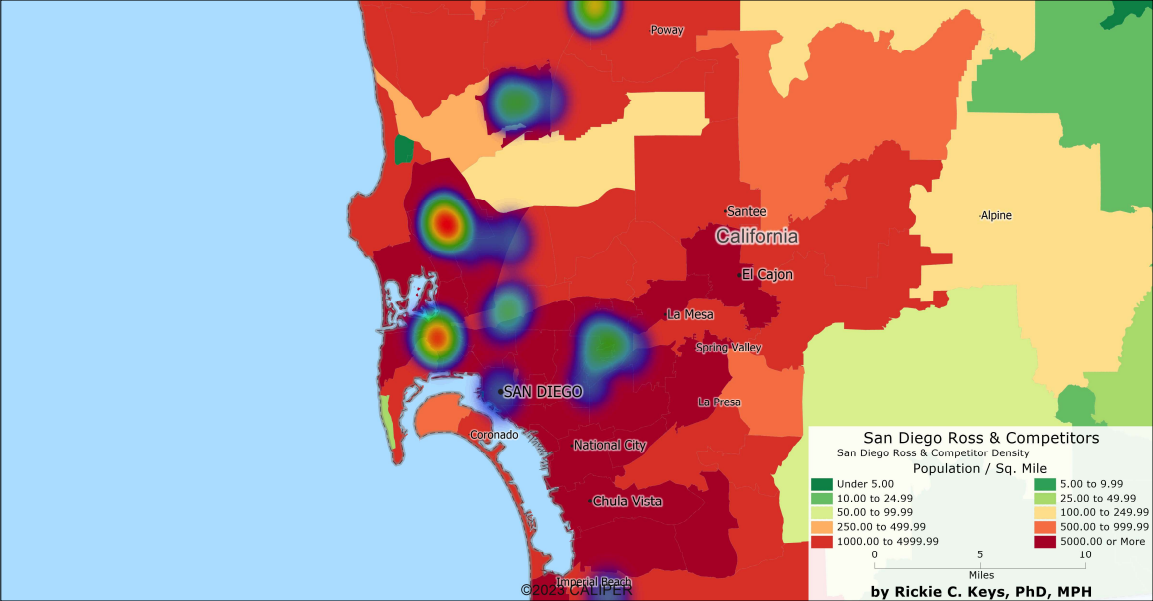
A map showcasing the geographical distribution of Ross's competitors, overlaid with Ross store locations to identify market gaps and areas of high competitive pressure.
Analysis: A comprehensive view of the competitive field aids Ross in identifying both crowded markets and underserved areas, guiding strategic decisions regarding expansion, product offerings, and marketing tactics.
Insight: The map reveals a concentration of competitors in central urban areas, while peripheral neighborhoods show less saturation, presenting opportunities for Ross to expand its footprint in San Diego.
Section 5: Strategic Recommendations
- Expand in Underserved Areas: Focus on expanding Ross stores in ZIP codes identified as having high population densities but low competitive presence.
- Tailor Product Offerings: Customize inventory to reflect local demographics and consumer spending behaviors, enhancing customer appeal and satisfaction.
- Innovate Marketing Strategies: Employ targeted marketing campaigns that resonate with the diverse consumer base in San Diego, leveraging digital and traditional media to maximize reach and engagement.
- Enhance Customer Experience: Invest in in-store layout improvements and customer service enhancements to differentiate Ross from competitors, particularly in highly competitive areas.
Section 6: Conclusion
This report underscores significant opportunities for Ross Dress for Less to bolster its market presence in San Diego through strategic store placement, demographic-aligned product offerings, and savvy marketing campaigns. Emphasizing tailored approaches to meet the unique needs of San Diego's diverse customer base can propel Ross toward increased growth and profitability in this competitive retail landscape.